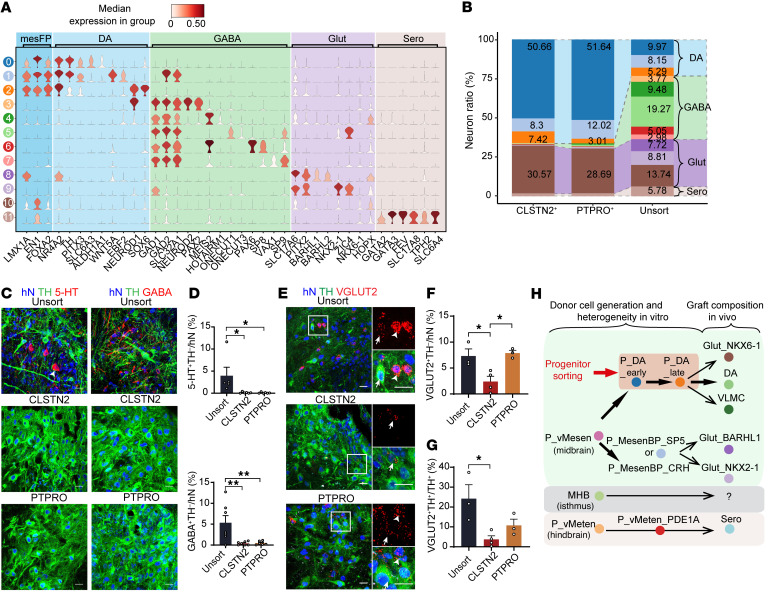
Figure 12. Grafts from CLSTN2- or PTPRO-enriched progenitors contain enriched mDA neurons with most off-target neuron types depleted.
(A) Violin plot of representative markers for all graft neuronal clusters. (B) Neuronal subtype ratio for each graft group (unsorted, CLSTN2, and PTPRO). (C and D) Typical images of grafts immunostained for 5-HT (C, left) or GABA (C, right) and the mDA marker TH. Quantification of 5-HT+ (D, top) and GABA+ neuron ratios (D, bottom) in grafts for each group. *P < 0.05 and **P < 0.01, by 1-way ANOVA followed by Tukey’s multiple-comparison test. (E–G) Representative images of grafts immunostained for VGLUT2 (RNAScope) and TH (E). Arrowheads and arrows indicate VGLUT2+TH– neurons and TH+ neurons with weak VGLUT2 expression, respectively. Quantification of VGLUT2+TH–/hN ratio (F) and the VGLUT2+TH+/TH+ ratio (G). Scale bars: 20 μm. *P < 0.05, by 1-way ANOVA followed by Tukey’s multiple-comparison test. (H) Proposed model of how heterogenous donor cells generated in vitro result in grafts with diverse neuronal composition in vivo. Graft outcomes can be improved and predicted after mDA progenitor sorting via specific markers.

