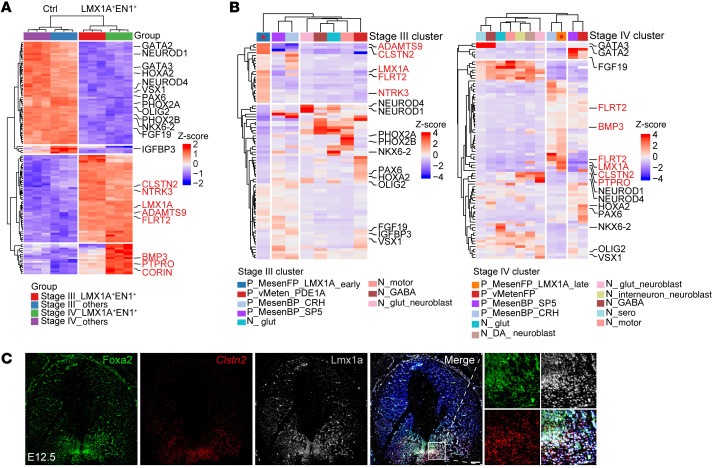
Figure 6. Identified surface markers are coexpressed with classical mDA progenitor markers in vitro and in developing mouse ventral midbrain.
(A) Heatmap showing scaled expression of 4 groups of top 40 DEGs (stage III LMX1A+EN1+ and control; stage IV LMX1A+EN1+ and control). Control cells were collected from LMX1A–EN1–, LMX1A+EN1–, and LMX1A–EN1+. DEGs in LMX1A+EN1+ cells are shown in red, and DEGs in control cells are shown in black. (B) Heatmap showing scaled expression of same DEGs from A projected onto stage III (left) and stage IV (right) scRNA-Seq clusters. Marker genes are shown in the same color as in A. (C) RNA-FISH of Clstn2 following IHC by colabeling Foxa2 and Lmx1a in E12.5 mouse mesencephalon. The zoomed views indicate magnified images of Foxa2+Lmx1a+Clstn2+ progenitors. Scale bars: 100 μm. Original magnification, ×20 (higher-magnification images).

