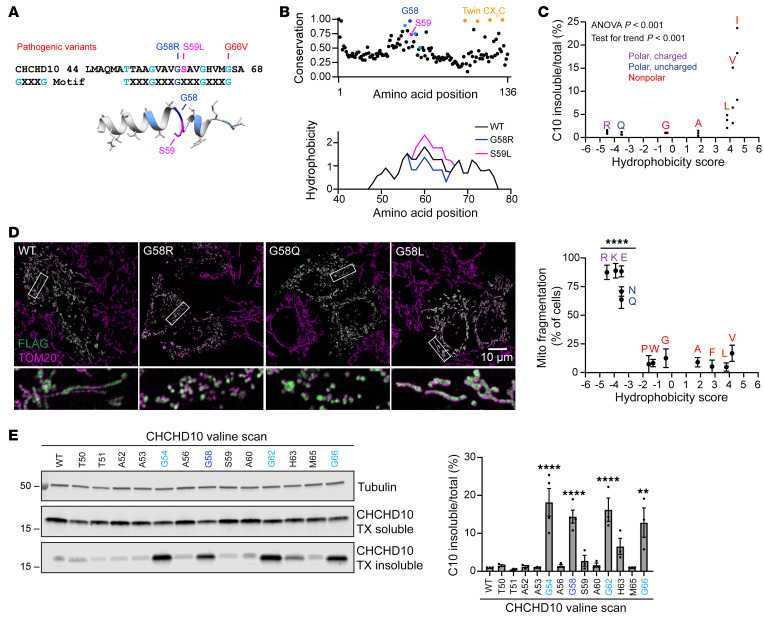
Figure 2. The C10 G58 position is highly conserved and lies on an insolubility-prone face of the α-helix.
(A) Top: Amino acid sequence of the hydrophobic α-helix of C10 showing pathogenic variants and highlighting the GXXXG motif. Bottom: EVfold prediction of the structure of the α-helix. (B) EVcouplings conservation analysis of C10 and predicted hydrophobicity of the region around the α-helix. (C) Levels of insoluble/total C10 in HEK293 C2/C10-DKO cells after transfection with C10 containing G58 substitutions with amino acids of varying hydrophobicity on the Kyte-Doolittle scale (x axis) (n = 3 biological replicates). (D) Representative Airyscan images of mitochondria in HeLa cells transfected with C10 containing the indicated G58 substitutions. Scale bar: 10 μm. Original magnification, ×5 (bottom images). Plot shows quantification of mitochondrial (Mito) fragmentation in HeLa cells transfected with C10 containing G58 substitutions with amino acids of varying hydrophobicity (n ≥50 cells per replicate from 3 biological replicates; individual data points are shown in Supplemental Figure 4B). (E) Representative blot of a Triton X–soluble/–insoluble (TX-soluble/-insoluble) assay of HEK293 C2/C10-DKO cells transfected with C10, whereby individual residues of the α-helix were mutated to valines. Graph shows quantification of the blots (n = 3–4 biological replicates). Error bars represent the SEM. **P < 0.01 and ****P < 0.0001, by 1-way ANOVA with Dunnett’s T3 multiple comparisons with pooled variance (D) or Sidak’s multiple comparisons (E). See also Supplemental Figure 4.

