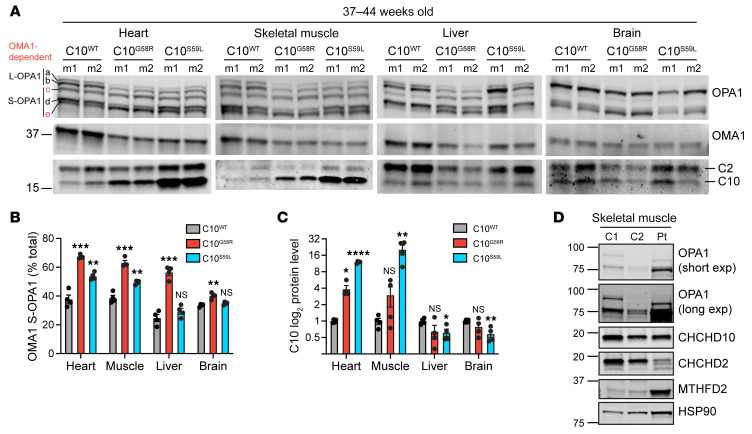
Figure 5. OMA1 is activated in C10 G58R mouse tissue.
(A) Immunoblots of OPA1, OMA1, C2, and C10 in different tissues from 37- to 44-week-old C10WT, C10G58R, and C10S59L mice. The loading controls are shown in Supplemental Figure 5A. (B) Quantification of OMA-cleaved OPA1 bands (c+e/total) from A (n = 4 mice per genotype). (C) Quantification of C10 levels from A. (D) Immunoblot of OPA1 levels from the C10 G58R proband (patient III-3) and 2 nonmyopathic controls. C, control, exp, exposure; Pt, patient. Error bars represent the SEM. *P < 0.05, **P < 0.01, ***P < 0.001, and ****P < 0.0001, by 1-way ANOVA with Dunnett’s T3 multiple comparisons. See also Supplemental Figure 5.

