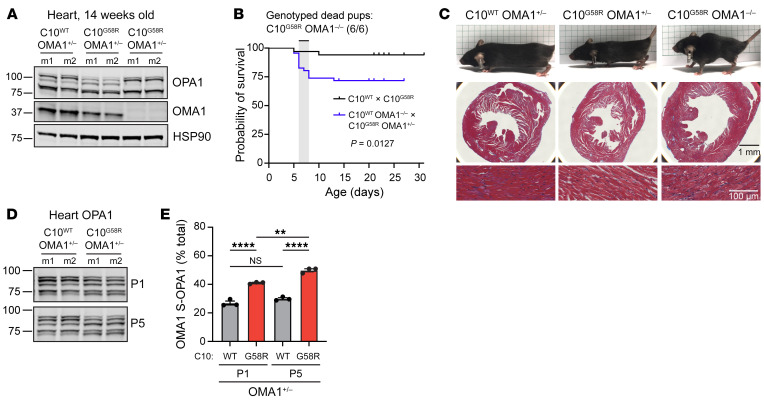
Figure 7. OMA1 is critical for C10 G58R pup survival.
(A) Immunoblot of OPA1 and OMA1 levels in 14-week-old littermates of the C10WT OMA1–/– and C10G58R OMA1+/– cross. m, mouse (n = 4 mice per genotype). (B) Survival curves for pups from the C10WT and C10G58R cross and the C10WT OMA1–/– and C10G58R OMA1+/– cross. All 6 dead pups genotyped from the latter cross were C10G58R OMA1–/– (n = 18 pups from the C10WT and C10G58R cross; n = 46 pups from C10WT OMA1–/– and C10G58R OMA1+/– cross). (C) Top: 14-week-old littermates from the C10WT OMA1–/– and C10G58R OMA1+/– cross. Middle: Masson’s trichrome (MT) stainings of mouse hearts. Bottom: Magnified MT stainings of heart showing prominent vacuolation in C10G58R OMA1–/– hearts (n = 3 mice per genotype). Scale bars: 1 mm (middle) and 100 μm (bottom). (D) Immunoblot of OPA1 levels in hearts from C10WT or C10G58R mice on the OMA1+/– background, on P1 and P5. Loading controls are shown in Supplemental Figure 9G (n = 3 mice per genotype). (E) Quantification of OMA-cleaved OPA1 bands (c+e/total) from immunoblot data in D. Error bars represent the SEM. **P < 0.01 and ****P < 0.0001, by log-rank test (B) and 2-way ANOVA with Sidak’s multiple comparisons (E). See also Supplemental Figure 9.

