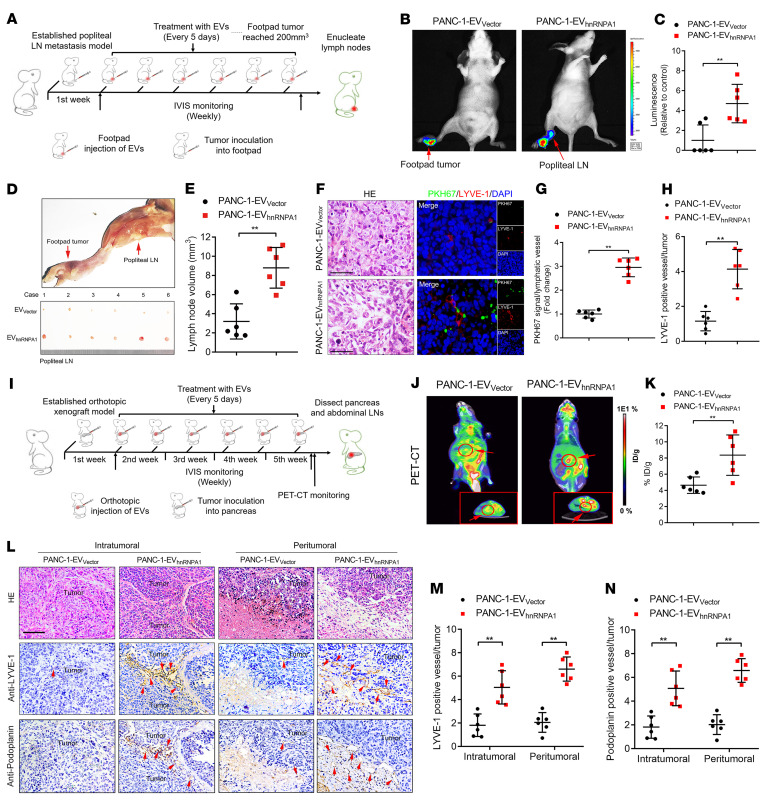
Figure 3. EV-packaged hnRNPA1 induces LN metastasis of KRASG12D PDAC in vivo.
(A) Schematic representation of the establishment of the popliteal lymphatic metastasis model. (B and C) Representative images (B) and quantification (C) of bioluminescence of the popliteal metastatic LNs (n = 6 per group). Red arrows: Footpad tumor and metastatic popliteal LNs. The 2-tailed Student’s t test was used. (D and E) Representative image (D) of popliteal lymphatic metastasis model. Quantification (E) of the popliteal LN volume is shown. Red arrows: Footpad tumor and metastatic popliteal LNs. The 2-tailed Student’s t test was used. (F–H) Representative H&E-stained and immunofluorescence images (F) and quantification of PKH67-labeled EVs (G) or LYVE-1–positive lymphatic vessel density (H) in footpad tumors. Scale bars: 50 μm. The 2-tailed Student’s t test was used. (I) Schematic representation of orthotopic xenograft model establishment. (J and K) Representative images of PET-CT images of orthotopic tumors. Red arrows: Orthotopic tumor. 18FDG accumulation in the pancreas was assessed (n = 6 per group). ID, injected dose. The 2-tailed Student’s t test was used. (L–N) Representative H&E-stained and IHC images (L) and quantification (M and N) of LYVE-1–positive or podoplanin-positive lymphatic vessel density in orthotopic tumors (n = 6 per group). Scale bar: 50 μm. The 2-tailed Student’s t test was used. Data are presented as mean ± SD; 3 independent experiments were performed. *P < 0.05, **P < 0.01.

