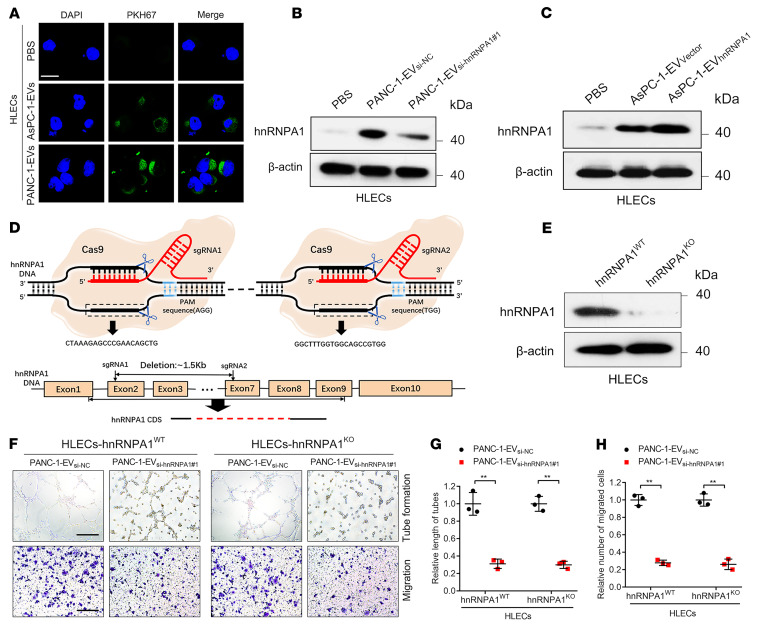
Figure 7. EV-packaged hnRNPA1 is delivered to HLECs.
(A) Representative fluorescence images of HLECs after incubation with PKH67-labeled EVs. Scale bar: 5 μm. (B and C) Western blotting analysis of hnRNPA1 expression in PBS- or EV-treated HLECs. (D) Schematic representation of CRISPR/Cas9-mediated hnRNPA1 deletion in HLECs. (E) Western blotting analysis validation of hnRNPA1 knockout in HLECs. (F–H) Representative images (F) and quantification of tube formation (G) and migration (H) of EV-treated hnRNPA1WT or hnRNPA1KO HLECs. Scale bars: 100 μm. The 2-tailed Student’s t test was used. Data are presented as mean ± SD of 3 independent experiments. **P < 0.01.

