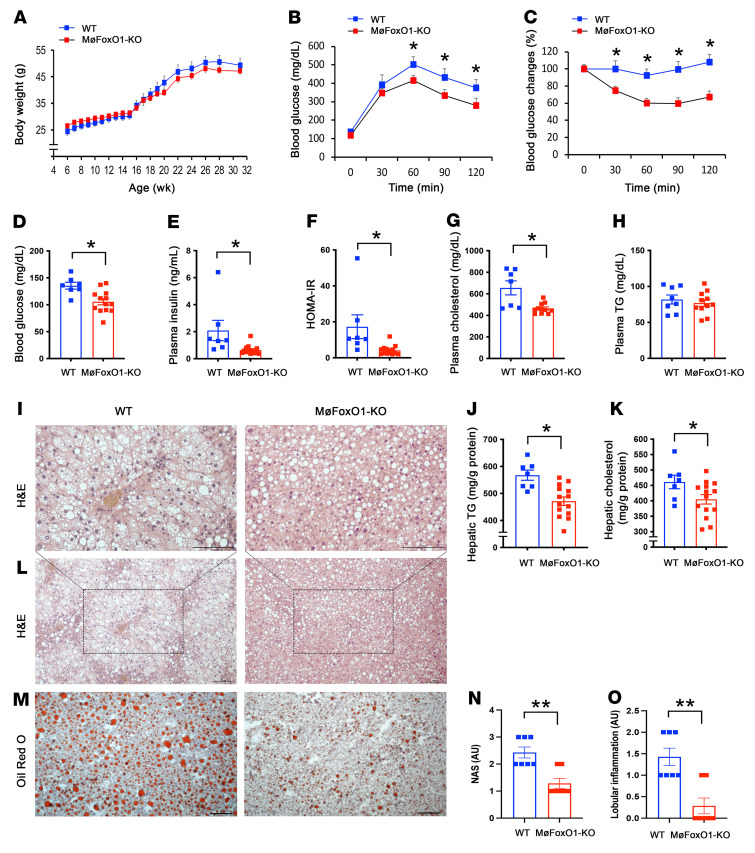
Figure 5. Myeloid FoxO1 depletion protects against diet-induced NASH.
MøFoxO1-KO and WT littermates (male, 6 weeks old) were fed a NASH diet for 25 weeks. (A) Body weight. (B) Glucose tolerance test. (C) Insulin tolerance test. (D) Fasting blood glucose levels. (E) Fasting plasma insulin levels. Fasting blood glucose and plasma insulin levels were measured in mice after 16-hour fasting. (F) HOMA-IR. (G) Plasma cholesterol levels. (H) Plasma TG levels. Both groups of mice were euthanized after 16-hour fasting following 25 weeks of NASH diet feeding. Liver tissues were procured for histological examination. (I) H&E staining of liver sections (original magnification, ×20). Scale bars: 100 μm. (J) Hepatic TG content. (K) Hepatic cholesterol content. (L) H&E staining of liver sections (original magnification, ×10). Scale bars: 100 μm. (M) Oil Red O staining of liver sections (original magnification, ×10). Scale bars: 100 μm. (N) NASH score (NAS). (O) Lobular inflammation. Data are expressed as mean ± SEM (n = 6–11). Statistical analysis in A–H, J, K, N, and O was performed using a 2-tailed, unpaired t test. *P < 0.05, **P < 0.01.

