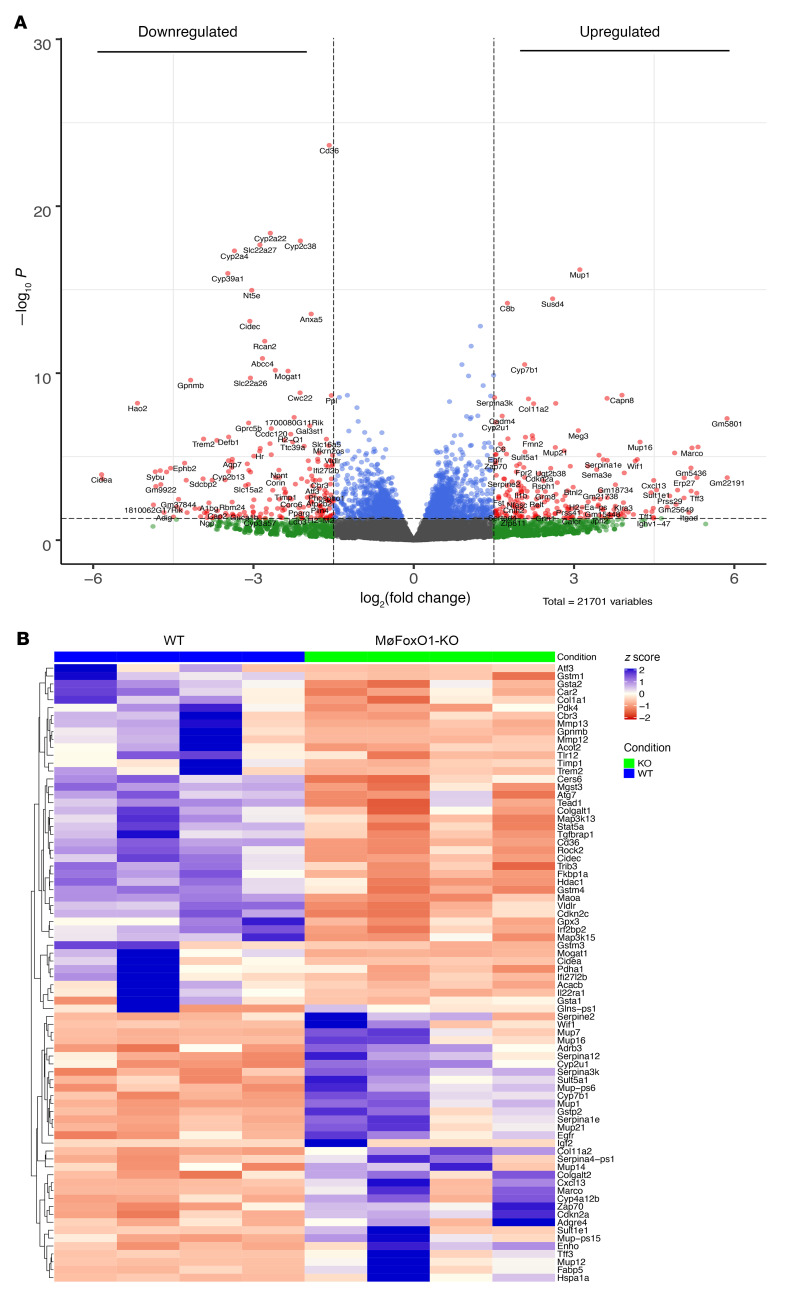
Figure 7. Comparative transcriptomic analysis.
MøFoxO1-KO and WT littermates (male, 6 weeks old) were fed a NASH diet for 25 weeks. Mice in both groups (n = 4/group) were euthanized after 16-hour fasting. Aliquots of liver tissues (10 mg) were used for preparing total RNAs, which were analyzed by RNA-Seq assay, followed by comparative transcriptomic analysis. (A) Volcano plot. Plotted are P values versus log2(fold change) of 342 DEGs, of which 85 genes were upregulated and 257 genes were downregulated in the liver of MøFoxO1-KO versus WT littermates. (B) Heatmap of RNA-Seq gene counts. Shown are the significant DEGs that are critical for insulin action and hepatic metabolism.

