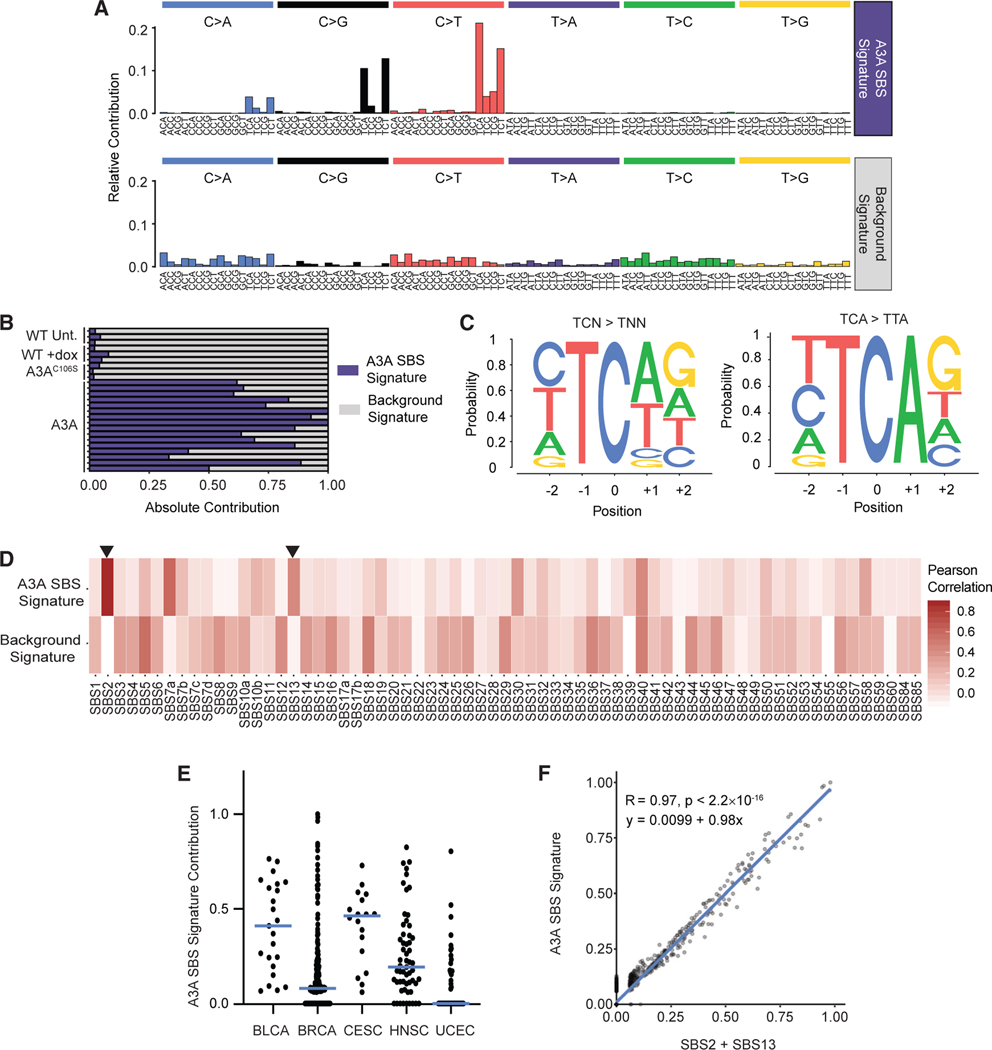
Figure 2. The mutational signature of APOBEC3A activity is prevalent in human cancers.
(A) From the entire spectrum of mutations found in DT40-A3A descendant clones and controls, two SBS mutational signatures were derived using non-negative matrix factorization (NMF). The relative contribution of each SBS (top, x axis) within a trinucleotide context (bottom, x axis) is shown. The mutational signature consistent with APOBEC3A deaminase activity is denoted the A3A SBS Signature.
(B) The contribution of each experimentally derived mutational signature for individual descendant clones.
(C) The pentanucleotide context in which cytidine mutations occur in DT40-A3A descendant clones. Letter size represents relative frequency of each base flanking mutated cytidines. Shown is the pentanucleotide context of all TC > TN mutations, where N is any nucleotide (left), and TCA > TTA mutations (right). p < 0.0001 by Fisher’s exact test for the overrepresentation of G.
(D) The two experimentally generated mutational signatures derived from DT40-A3A genomes are compared with the SBS signatures defined in COSMIC v.3. Pearson’s correlation was used to generate the heatmap. Arrows mark SBS2 and SBS13, attributed previously to APOBEC3 activity.
(E) Cancer genomes from tissues associated previously with APOBEC3 were evaluated for A3A SBS Signature mutations. The fraction of A3A SBS Signature mutations in individual tumors from PCAWG is shown for bladder cancer (BLCA), breast adenocarcinoma (BRCA), cervical squamous cell carcinoma (CESC), head and neck squamous cell carcinoma (HNSC), and uterine corpus endometrioid carcinoma (UCEC). The bar indicates the median.
(F) All cancer genomes from PCAWG were evaluated for SBS2 and SBS13 mutations compared with A3A SBS Signature mutations. The slope, R value, andsignificance (p value) of the correlation were determined using linear regression.

