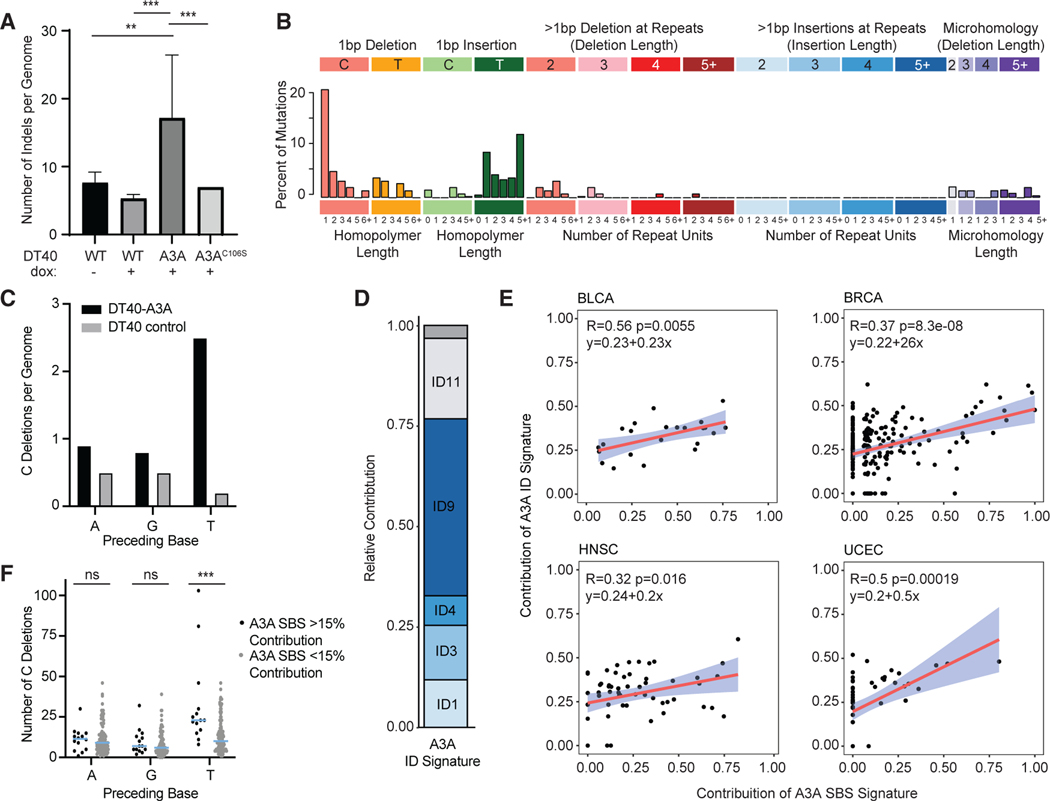
Figure 3. APOBEC3A-related deletions in cancer genomes.
(A) Indels are increased in genomes exposed to APOBEC3A. The numbers of insertions and deletions per genome are displayed as an average of all descendant clone genomes evaluated for each cell type. Statistical analysis was performed using a two-tailed t test. ***p < 0.005, **p < 0.01; error bars indicate SD.
(B) The indel signature generated by APOBEC3A. Indels unique to the DT40-A3A genomes are characterized by indel length (top, x axis) and homology/repeat regions (bottom, x axis).
(C) The context of cytidine deletions in cultured DT40 genomes. The base preceding all C deletions in DT40 descendant clones is shown. DT40 controls include untreated WT, dox-treated WT, and DT40-A3AC106S.
(D) Indel signature deconstruction into COSMIC v.3 ID signatures. The contribution of each COSMIC ID signature to the A3A ID Signature is shown. An empty gray bar denotes combined remaining ID signature contributions.
(E) Correlation between A3A ID and SBS Signature contribution in PCAWG whole genomes. Tumor genomes from PCAWG were analyzed for the presence of theA3A SBS Signature (x axis) and the A3A ID Signature (y axis). The slope, confidence interval, and R and p values of linear regression for each dataset are shown. Shown are BLCA, BRCA, HNSC, and UCEC.
(F) The context of cytidine deletions in cancer. The base preceding cytidine deletions was analyzed in breast cancers with more than 15% A3A SBS Signature contribution (black dots) or less than 15% (gray dots). Each dot represents an individual tumor sample, the bar indicates the mean, and error bars indicate SEM. Statistical analysis was performed using Wilcoxon rank-sum test. ***p < 0.005; ns, non-significant.

