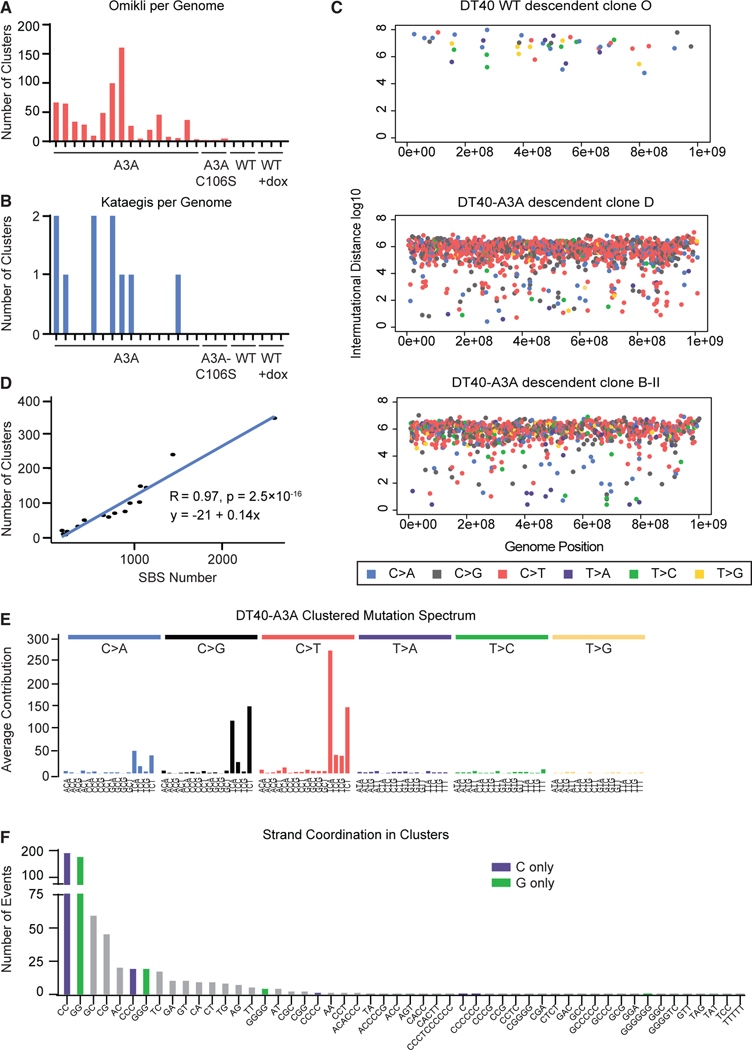
Figure 4. APOBEC3A activity generates clustered mutations.
(A and B) The number of mutation clusters per descendant clone genome are quantified as (A) omikli, defined as 2–4 mutations, or (B) kataegis, defined as 5 or more mutations within 20 kb.
(C) Rainfall plots from representative descendant clones. All SBSs within a single genome are plotted by genome position (x axis) and distance betweenneighboring mutations (y axis). Mutations in close proximity appear toward the low end of the y axis. Dot color indicates a specific base substitution (shown in the legend).
(D) The number of mutation clusters is correlated with the number of total base substitutions in DT40-A3A descendant clones. The slope and R and p values oflinear regression are shown.
(E) The averaged spectrum of mutations located within kataegis and omikli clusters from all DT40-A3A descendant clones.
(F) Mutation clusters are quantified according to number and type of bases altered within each cluster; for example, only C mutations, only G mutations, orcombinations of base mutations. Mutated bases within each cluster are shown on the x axis. C-only and G-only clusters, which indicate strand coordination of deaminase activity, are highlighted in purple and green, respectively.

