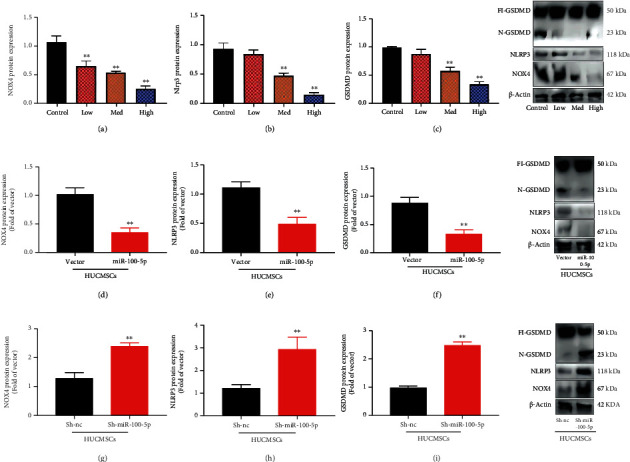
Figure 7.

NOX4/NLRP3 protein expression in NOX4, NLRP3, and GSDMD protein expression levels in the in vitro model by HUCMSCs; HUCMSCs promoted NOX4, NLRP3, and GSDMD protein expression (a)–(c), NOX4, NLRP3, and GSDMD protein expression levels in the in vitro model by overexpression of miR-100-5p + HUCMSCs (d)–(f), and NOX4, NLRP3, and GSDMD protein expression levels in the in vitro model by downregulation of miR-100-5p + HUCMSCs (g)–(i). Control: control group; low/med/high: low/med/high of the HUCMSC group. Vector: negative control group; miR-100-5p: overexpression of the miR-100-5p group; sh-nc: sh-negative control group; sh-miR-100-5p: downregulation of the miR-100-5p group; HUCMSCs: HUCMSC group; ∗∗p < 0.01 compared with vector or sh-negative control group.
