Figure 1.

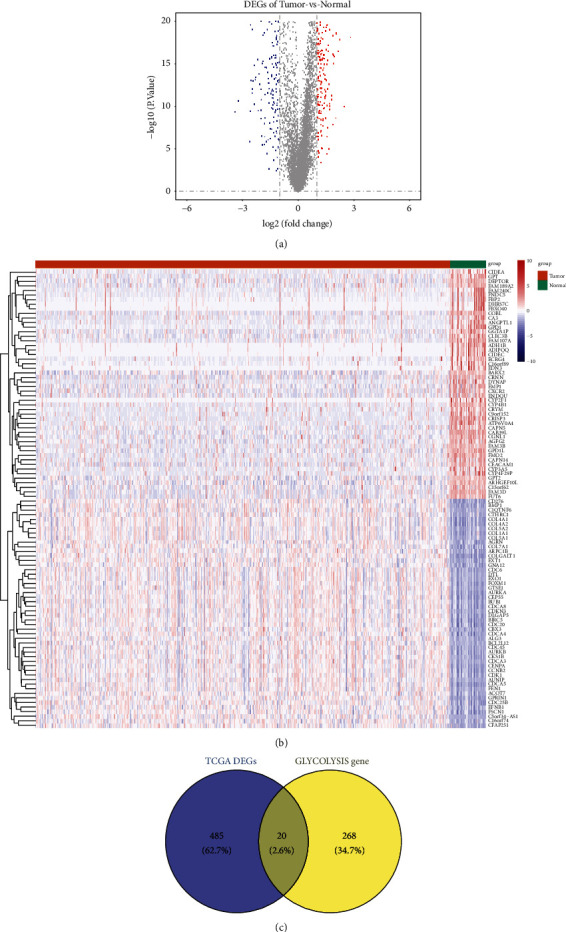
(a) Volcano plot showing the distribution of DEGs. (b) Heatmap showing the top 50 DEGs. (c) Venn diagram of DEGs common to the two GEO datasets. DEGs: differentially expressed genes; GEO: Gene Expression Omnibus.

(a) Volcano plot showing the distribution of DEGs. (b) Heatmap showing the top 50 DEGs. (c) Venn diagram of DEGs common to the two GEO datasets. DEGs: differentially expressed genes; GEO: Gene Expression Omnibus.