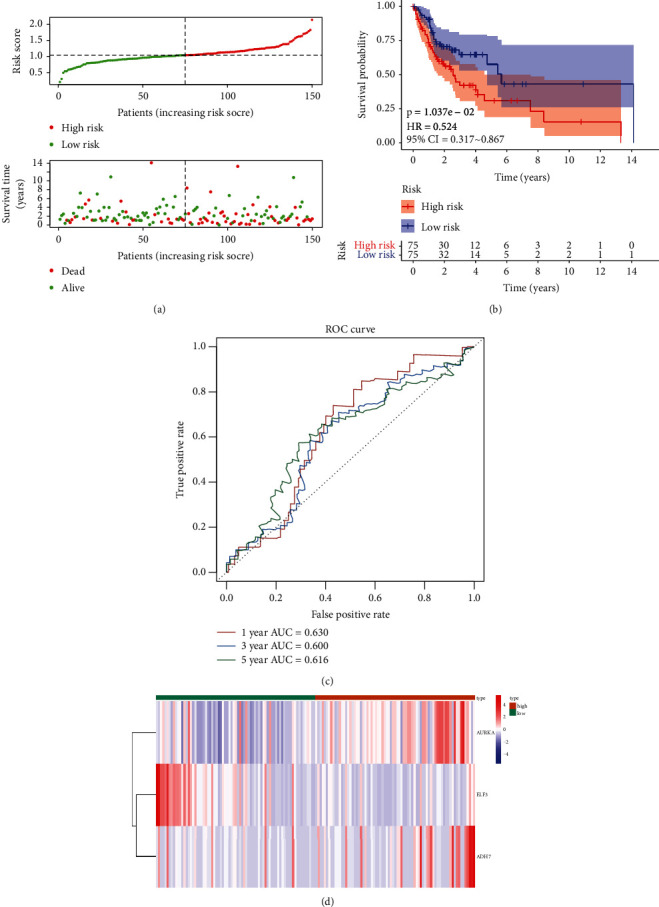
Figure 3.

Validation set evaluating the risk score system for the three genes on the testing set. (a) Relationships between the risk score and the number of deaths. (b) Overall survival of high- and low-risk patients. (c) ROC curve analysis of the predictive efficiency of the risk signature. (d) Heatmap showing AURKA, ADH7, and ELF3 expression.
