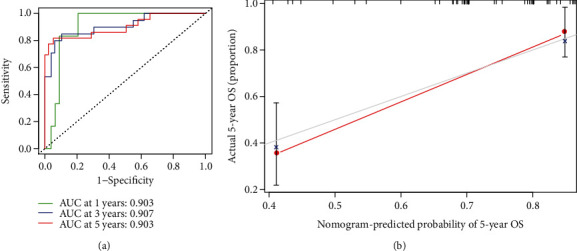
Figure 6.

(a) One-, three-, and five-year ROC plots. (b) An assessment of the association between the predicted and actual OS for the prognostic model using calibration plots. It indicates excellent calibration because the predictive probabilities match the actual probabilities.
