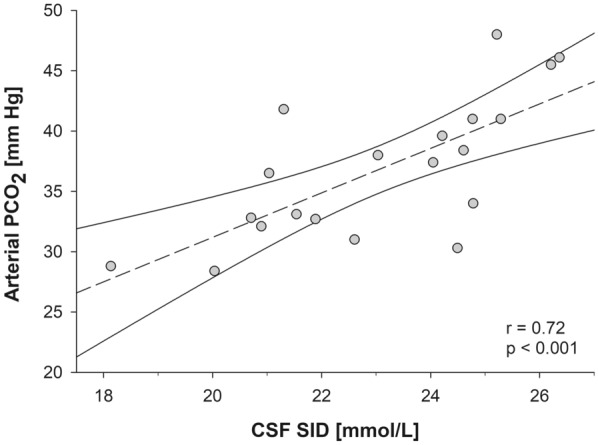
Fig. 2.

Scatter plot graph of CSF SID and arterial PCO2 in patients with SAH. Scatter Plot representing the association between CSF SID and arterial PCO2 in patients with SAH. Linear regression model (dashed line) is represented with 95% confidence interval. Equation of the linear model: Arterial PCO2 = 1.84 × CSF SID − 5.7. CSF cerebrospinal fluid, PCO2 partial pressure of carbon dioxide, SAH aneurismal subarachnoid hemorrhage, SID strong ion difference
