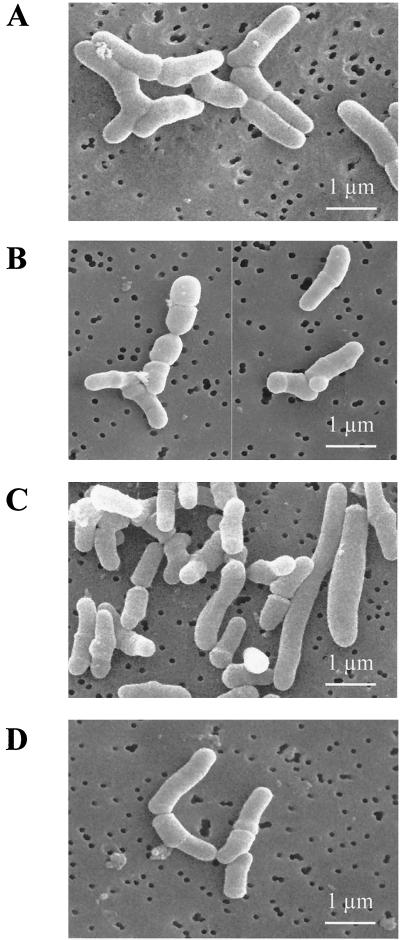
FIG. 2.
Analysis of morphological changes of P. freudenreichii SI41 during acid stress. Nontreated cells (A), cells undergoing extreme acid challenge at pH 2 (B), and pH 5 acid-adapted cells (C) were analyzed by scanning electron microscopy. For comparison, cells subjected to acid adaptation (pH 5) and then to extreme acid challenge (pH 2) were also analyzed (D).

