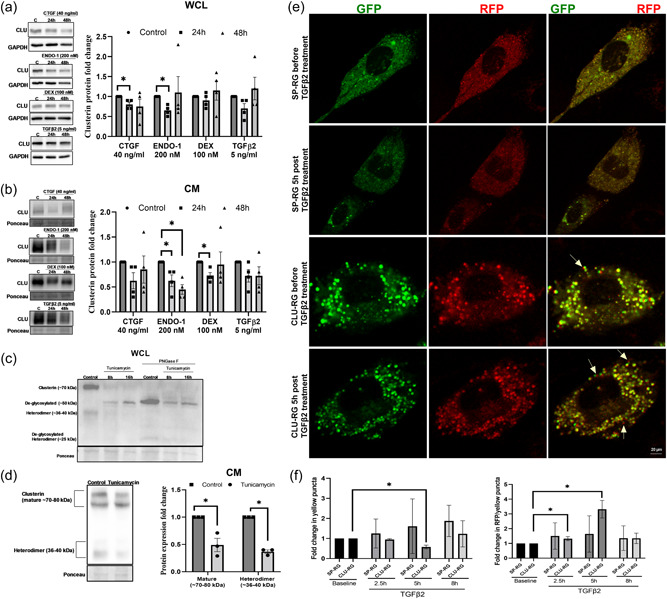
Figure 2.

Regulation of clusterin expression levels by stressors involved in modulating IOP. (a and b) Clusterin protein levels in response to 24 and 48 h treatment of connective tissue growth factor (CTGF)‐40 ng/ml, endothelin‐1 (ENDO‐1)‐200 nM, steroid dexamethasone (DEX)‐100 nM, transforming growth factor β2 (TGFβ2)‐5 ng/ml in WCL and CM. Clusterin expression was significantly reduced in WCL of HTM cells treated with CTGF and ENDO‐1 for 24 h. In CM, both 24 h and 48 h treatment of ENDO‐1 and 24 h treatment of DEX significantly reduced clusterin levels. (c) Effect of ER stress on clusterin expression. 1 µm tunicamycin treatment for 8 h and 16 h deglycosylated clusterin (~50 kDa). Peptide‐N‐glycosidase F (PNGase F) treatment on control and tunicamycin treated protein samples were used as positive controls for deglycosylation. PNGase F treated protein samples showed deglycosylated clusterin band at ~50 kDa and deglycosylated heterodimer band at ~25 kDa. (d) Tunicamycin treatment resulted in significant reduction in both mature secretory clusterin (~70–80 kDa) and heterodimer (~36–40 kDa). (e) Effect of TGFβ2 on bioavailability of clusterin. NTM cell lines were transfected with plasmid expressing either Clusterin‐RFP‐GFP (CLU‐RG) plasmids or control Signal Peptide‐RFP‐GFP (SP‐RG), followed by TGFβ2 treatment (5 ng/ml) after 48 h. Live‐cell imaging under confocal microscope was performed. Images were recorded before (baseline) and after TGFβ2 treatment (2.5, 5, and 8 h). Representative image of NTM cell for each condition is shown with GFP panel (left), RFP (middle), merge (right). Top two panels show cell transfected with SP‐RG before (panel in first row) and after TGFβ2 treatment (panel in second row). Third and fourth panel show cell transfected with CLU‐RG before (panel in third row) and after TGFβ2 treatment (panel in fourth row). Yellow arrows point towards red fluorescence puncta. Scale bar 20 microns. (f) Graphical representation of fold changes in fluorescence puncta. Fold changes in the ratio of colocalization (yellow puncta) (left panel) shows a significant decrease in yellow puncta fold change in CLU‐RG transfected cells at the 5 h post‐TGFβ2 treatment compared to the CLU‐RG baseline with no changes in fold change in the SP‐RG and RFP over colocalization (right panel) showed significant increase at 2.5 h and 5 h post‐TGFβ2 treatment. GAPDH or ponceau was used as a loading control for immunoblotting analysis. Values represent the mean ± SEM, where n = 3–4 (biological replicates). * p ≤ 0.05 was considered significant. CM, conditioned media; GFP, green fluorescent protein; IOP, intraocular pressure; RFP, red fluorescent protein; SEM, standard error of mean; WCL, whole‐cell lysate
