Figure 3.

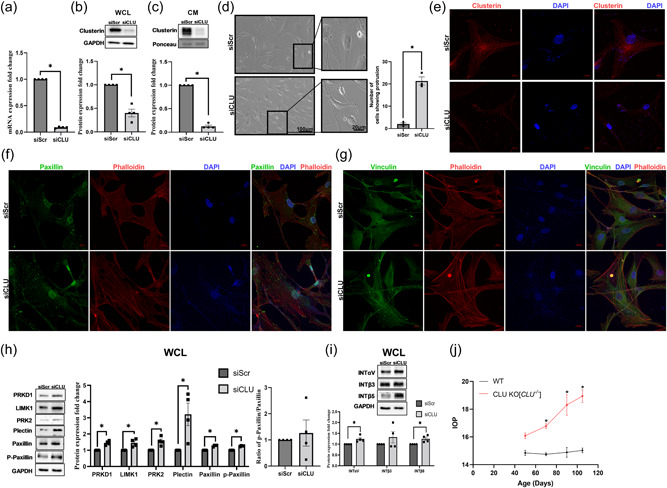
Effect of functional loss of clusterin on actin cytoskeleton and IOP. siRNA‐mediated knockdown of clusterin (siCLU) in serum‐starved HTM cells compared to control scramble (siScr) shows significant decrease in (a). clusterin mRNA, (b) clusterin protein levels in WCL, and (c) in CM GAPDH was used as a loading control for WCL, and Ponceau S‐band at 55 kDa was used for the CM. (d) Changes in cell shape due to siCLU (bottom panel) were compared to siScr (top panel) observed using light microscopy. Scale bar 100 microns. The inset panels represent the zoomed in image. Scale bar 20 microns. Histogram on the right represents the quantitative assessment of cell shape change based on the number of protrusions. (e) Reduced clusterin distribution (Alexa Flour 568/red) (bottom panel) due to siCLU compared with siScr (top panel). The nucleus was stained with DAPI in blue. Images were captured in z‐stack in a confocal microscope, and stacks were orthogonally projected. Scale bar 20 microns. (f and g) Increased distribution of actin stress fibers stained by phalloidin (red) with (f). paxillin, and (g) vinculin (Alexa Flour 488/green) seen in siCLU compared with siScr. The nucleus was stained with DAPI in blue. Images were captured in z‐stack in a confocal microscope, and stacks were orthogonally projected. Scale bar 100 microns. (h) and (i) Changes in the levels of actin cytoskeleton‐associated proteins due to loss of clusterin expression. Western blot analysis showed significant increase in the PRKD1, LIMK1, PRK2, plectin, paxillin, and phosphorylated paxillin. Ratio of phosphorylated paxillin to total paxillin demonstrated an increasing trend with no significance. Integrin‐ INTαV, INTβ5 showed significant increase in siCLU compared with siScr with no changes in INTβ3. GAPDH was used as a loading control for immunoblotting analysis. Values represent the mean ± SEM, where n = 4 (biological replicates). *p ≤ 0.05 was considered significant. (j) IOP values of wildtype (WT) and clusterin knockout (Clu ‐/‐ ) mice. Significant IOP elevation is observed in Clu ‐/‐ compared with WT by 70 days and continued over 90 and 105 days postnatal with no changes by 50 days. Data represented as mean ± SEM from 6 pairs of eyes (n = 6). *p ≤ 0.05 indicates statistical significance. IOP, intraocular pressure; mRNA, messenger RNA; SEM, standard error of mean
