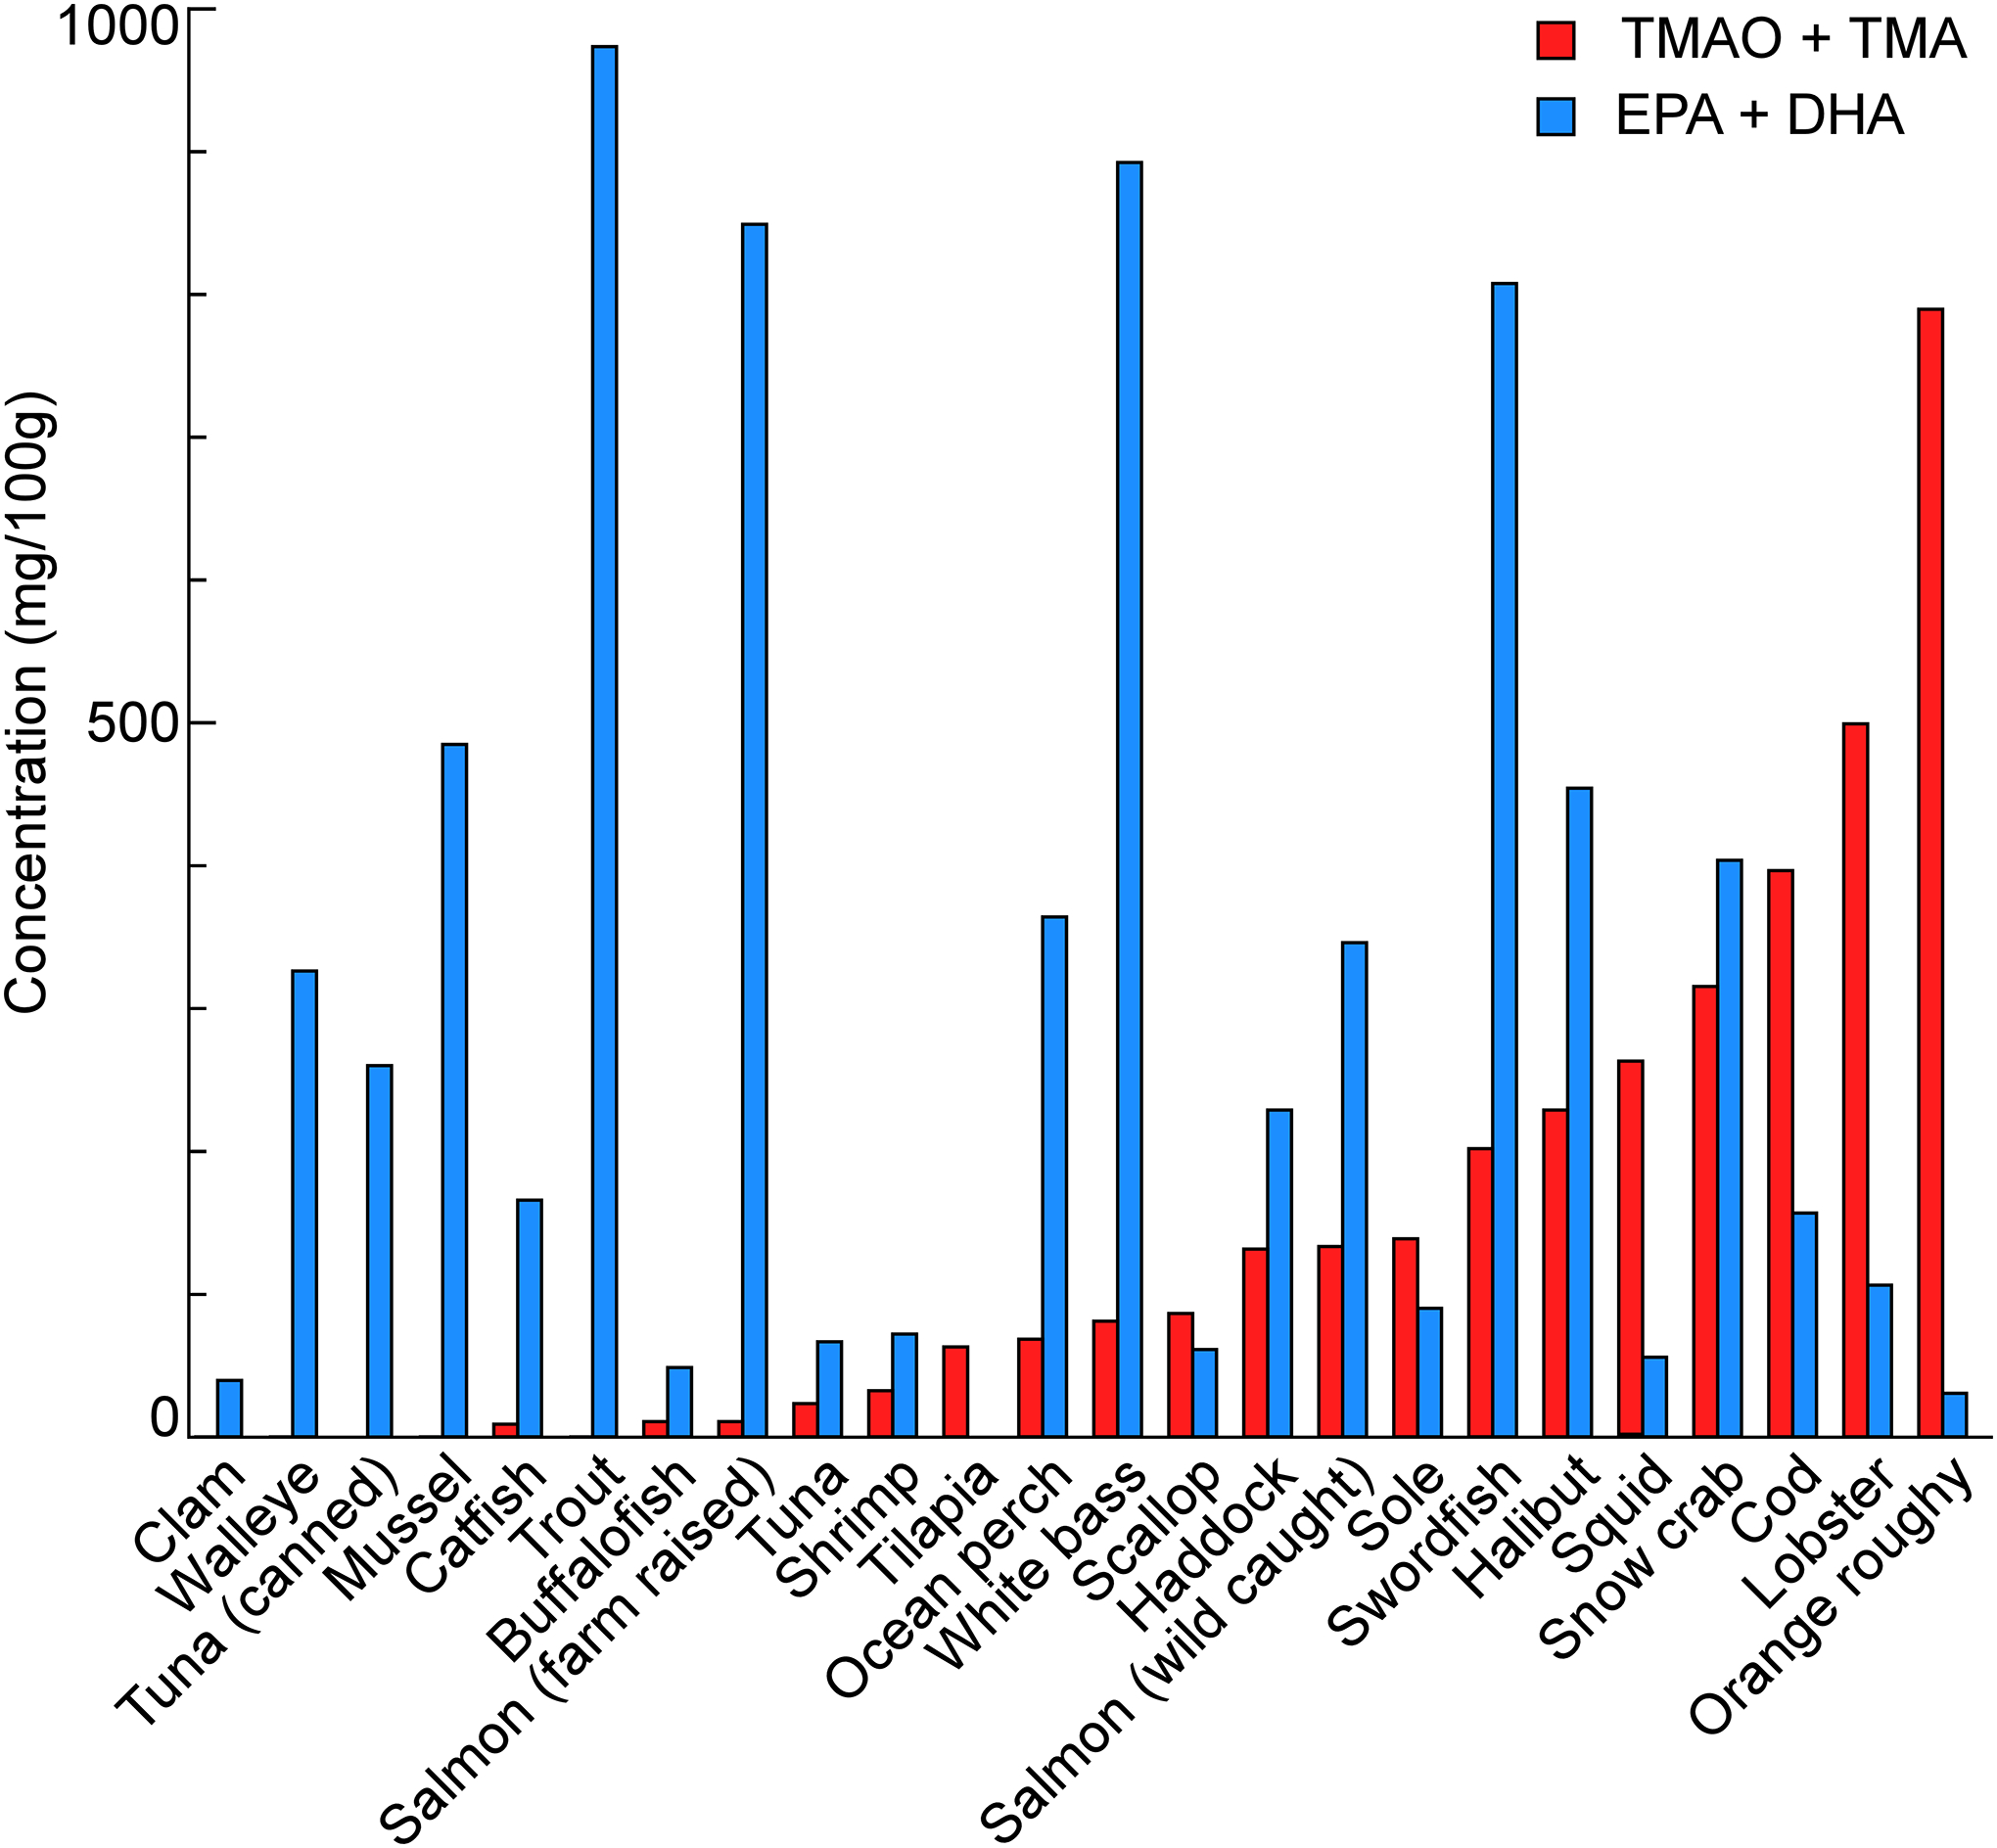
Figure 3. TMA+TMAO and EPA+DHA content in fish and seafood.

Fish and seafood was homogenized in water and the supernatant after ultra-centrifugation was quantified for TMAO and TMA. The EPA+DHA data was quantified by LC/MS/MS and several of them, cat fish, white bass, sole, walleye, ocean perch, Tuna and wild snow crab were collected from the references[31]. Data were shown as mean±SD from 3–5 independent replicates.
