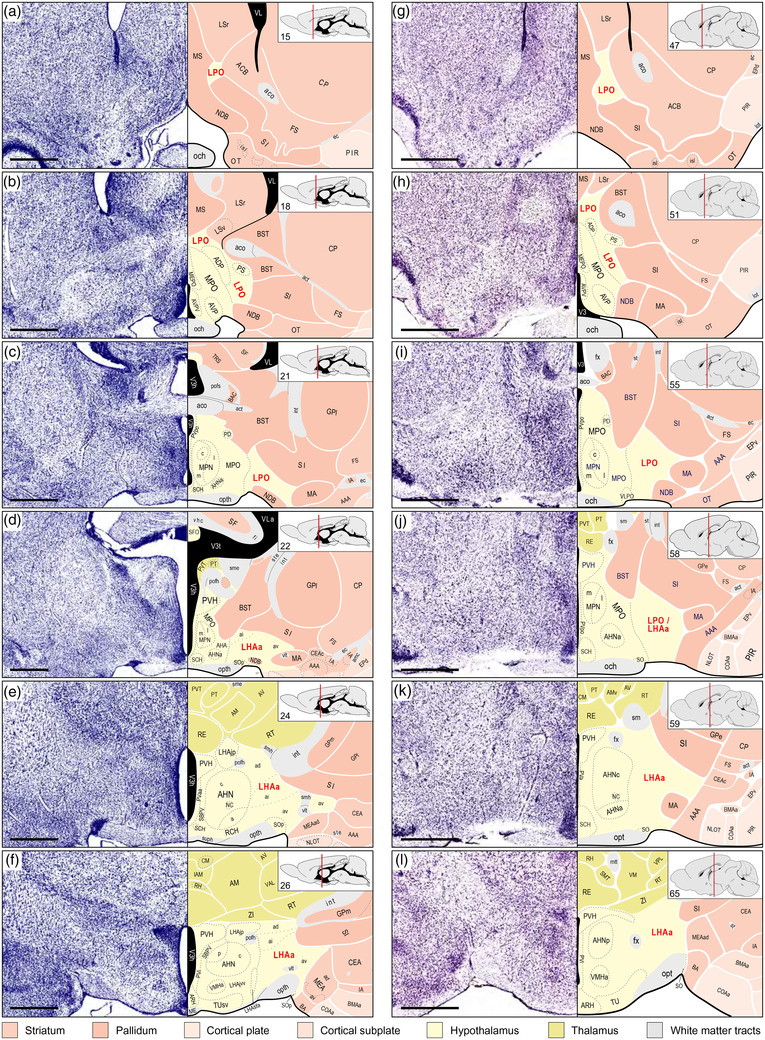
FIGURE 1.

Representative comparative overview of LPO and LHAa cytoarchitectural parcellation in rat and mouse. Two columns each show six comparable atlas levels (from rostral at top to caudal at bottom) and their corresponding Nissl cytoarchitecture, adapted from two widely used brain reference atlases, for rat (left column, a–f; BM4, Swanson, 2018), and mouse (right column, g–l; ARAv1, Dong, 2007). For each atlas level, insets (top right) give the atlas level number and show the rostral‐caudal position on a parasagittal schematic of the brain. To facilitate visual comparison, the mouse brain atlas levels are recolored to match the divisional color scheme applied to the rat brain atlas (color key below the figure). Panels a, c, and d, f show the starting (most rostral) and ending (most caudal) atlas levels of (respectively) the rat LPO and LHAa (labeled in red), with intervening atlas levels for each shown in b and e. Panels g–h show comparable atlas levels of the mouse brain atlas. Mouse LHAa provisional parcellation was determined with reference to its parcellation in the rat. According to LHAa parcellation in rat (BM4), it begins at the level of the anterior hypothalamic nucleus anterior part (AHNa); however, at a comparable atlas level in ARAv1, the same region is labeled LPO (indicated in j by LPO/LHAa label). The most caudal level of rat LHAa (f) is identified by the level of the hypothalamic paraventricular nucleus (PVH) immediately before its forniceal part appears; accordingly, a comparable atlas level is selected from ARAv1 as the provisional caudal end of the mouse LHAa (l). Bars are 1 mm (applies to Nissl images and their corresponding atlas levels). For abbreviations, see Supporting Information 1
