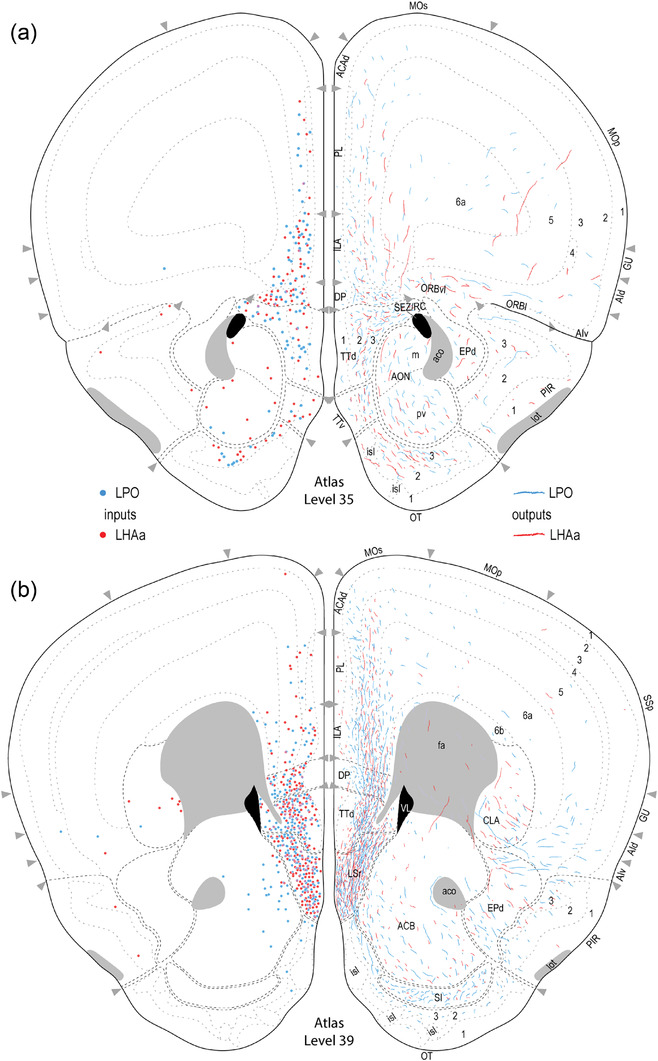
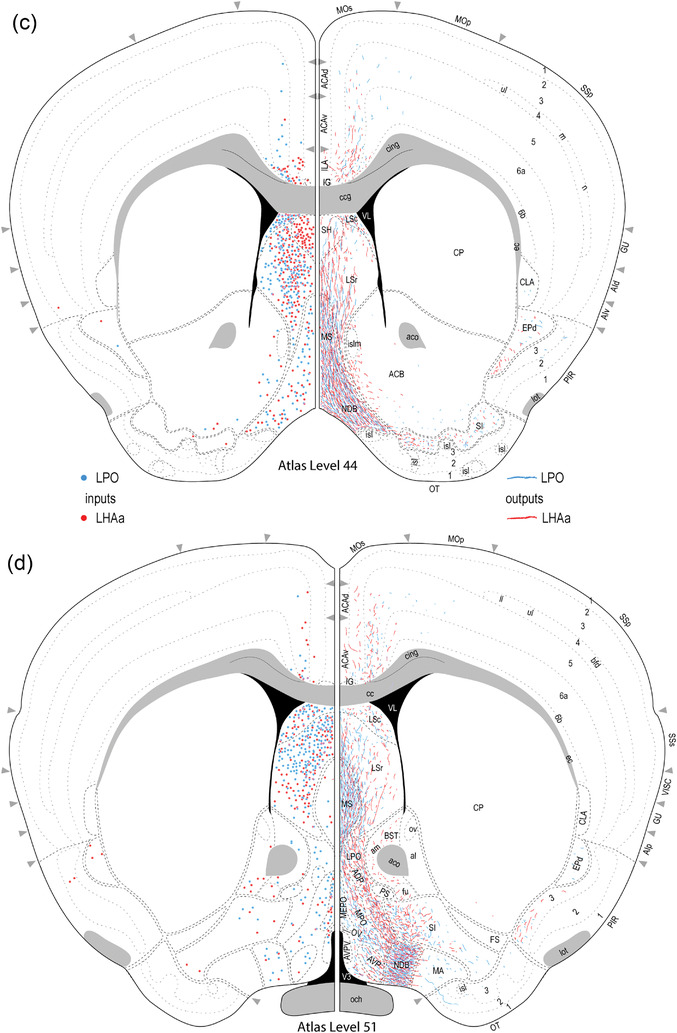
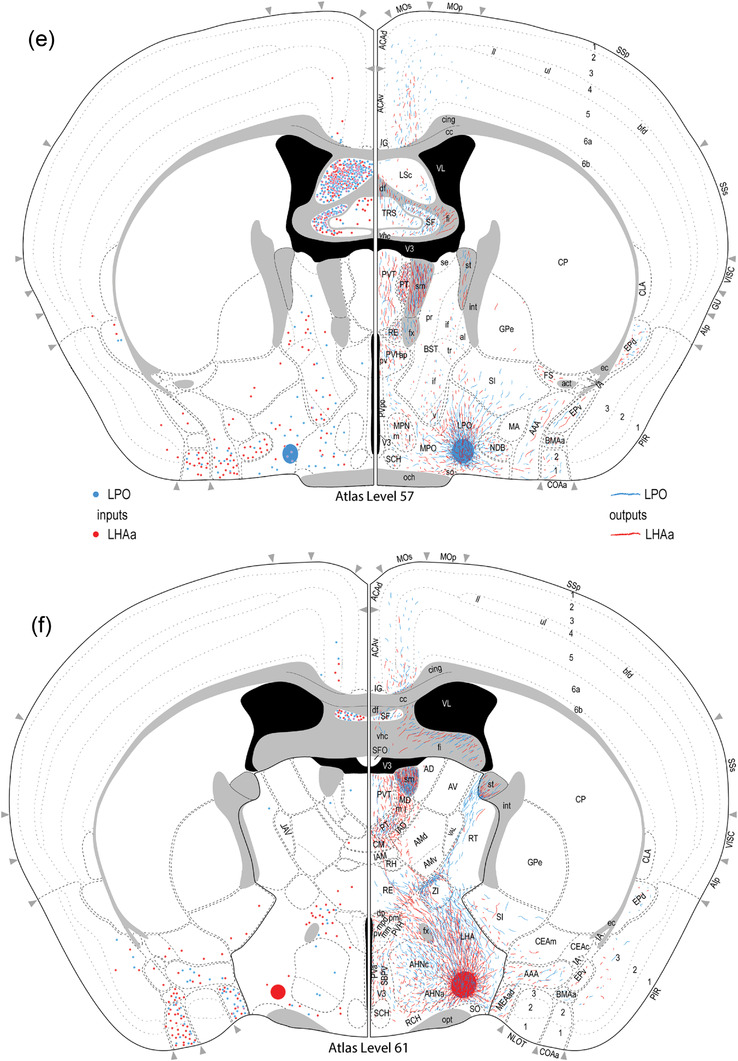
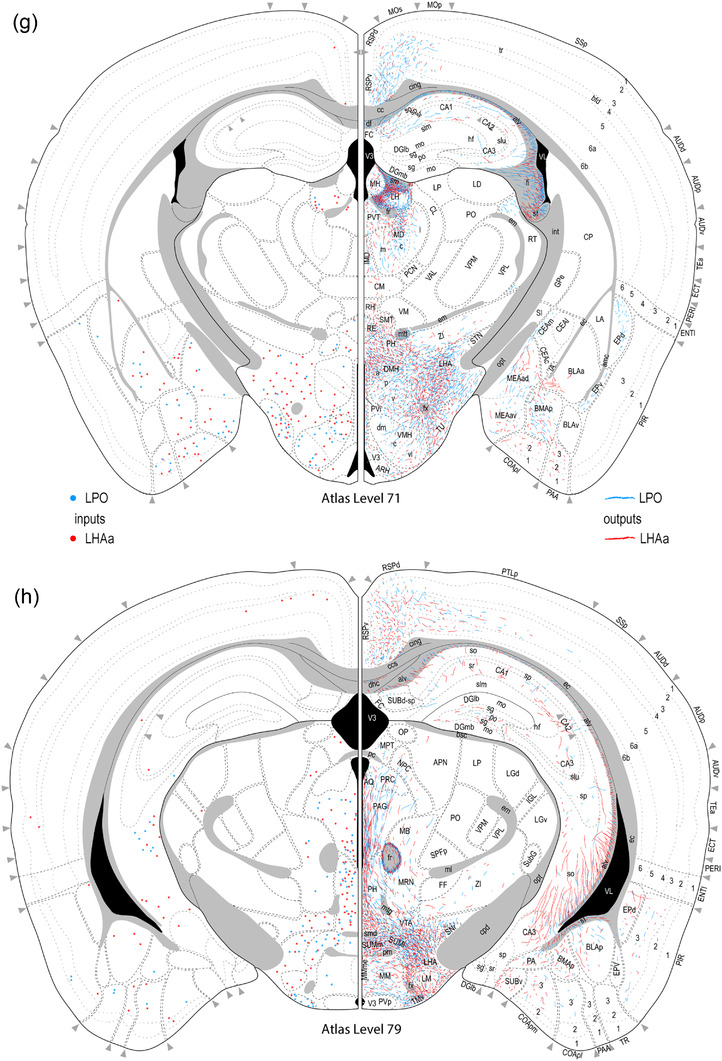
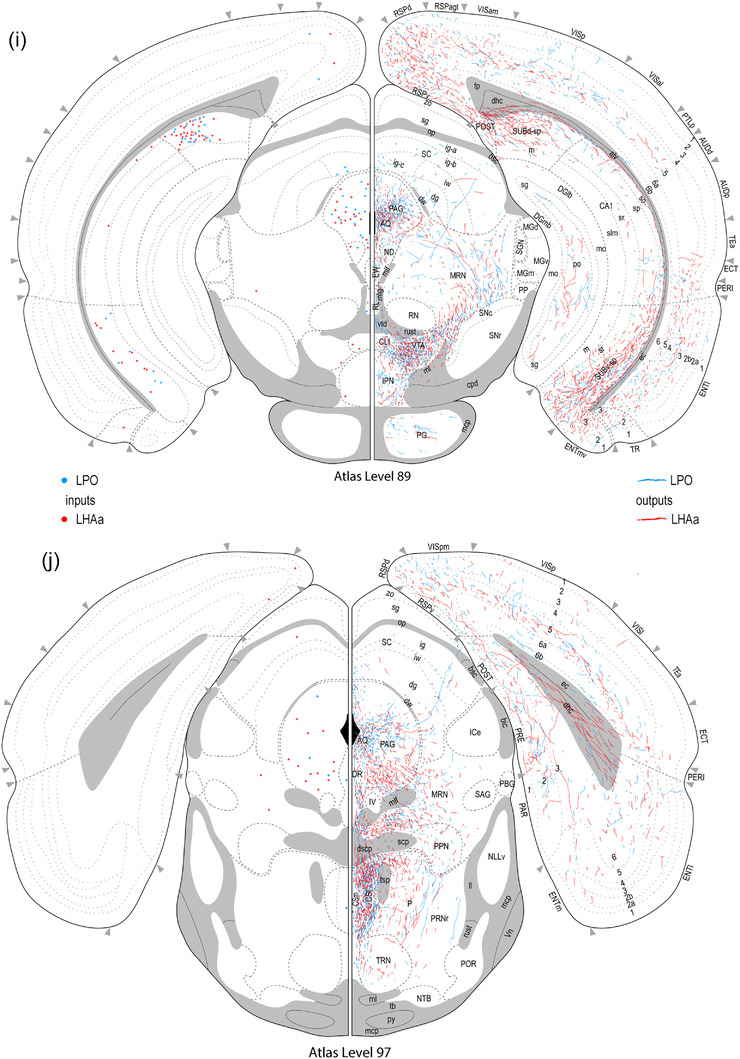
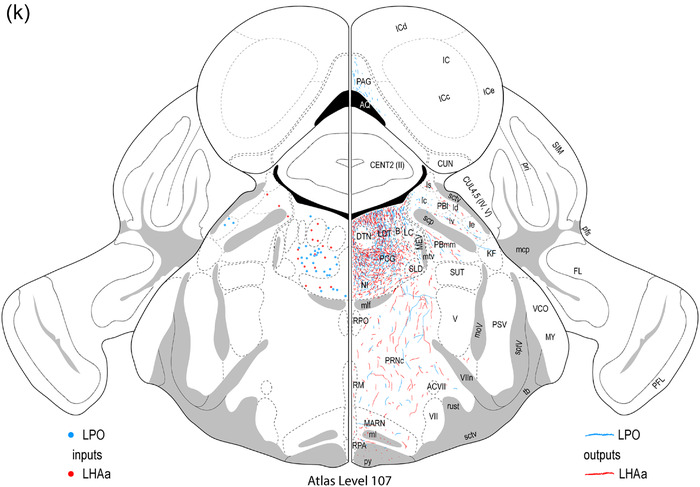
FIGURE 3.
Reference atlas maps of ipsilateral axonal outputs and inputs of the LPO (blue) and LHAa (red) shown for 11 representative atlas levels in a rostral‐caudal sequence for experiments #181221‐04A (LPO) and #181221‐02A (LHAa). The outputs (anterograde axonal labeling) are represented as colored lines, and inputs (axonal retrograde labeling of cell bodies) are represented as colored dots (tracer injection sites are represented on two atlas levels, for their additional extent, see Figure 2). To facilitate the direct comparison of the ipsilateral inputs and outputs, the inputs are reflected on the vertical axis (a gap is left intentionally between the reflected and nonreflected sides to emphasize that the reflected side showing the inputs is not the contralateral side). Numbers below each map correspond to the atlas level numbers in the reference atlas from which the maps are adapted (Dong, 2007). For abbreviations, see Supporting Information 1
