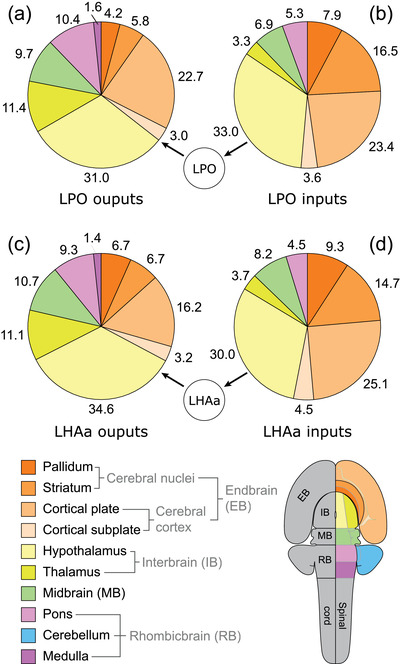
FIGURE 5.

Proportion of LPO and LHAa macroconnections with each of 10 major brain divisions. Four pie charts (a–d) show for 10 major brain divisions (encompassing the whole brain except for the spinal cord) the relative percentage of LPO (a, b) and LHAa (c, d) macroconnection outputs (a, c; anterograde tracing) and inputs (b, d; retrograde tracing) associated with them. The data are derived from two representative experiments (#181221‐04A [LPO] and #181221‐02A [LHAa]). The relative percentage for each division (numbers adjacent to pie segments) reflects the proportion of the average connection weight. For output connections, averages are calculated from ordinal values ranging from 1 to 7; for input connections, the averages are calculated from neuron counts assigned to one of seven bins (see Table 1). Pie chart segment colors represent the brain divisions shown in the flatmap (bottom right), and their divisional relationships and parent divisions are shown in the hierarchy tree below (bottom left)
