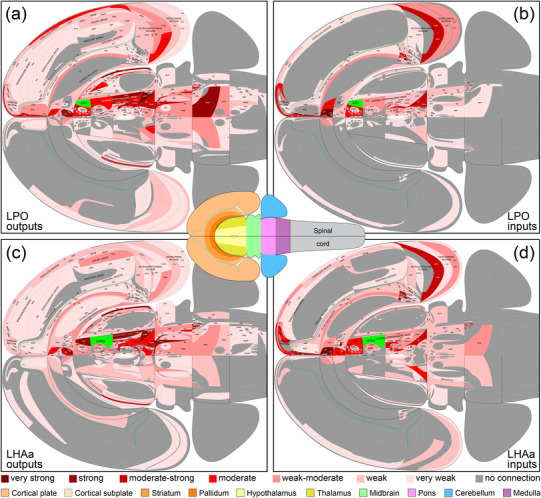
FIGURE 6.

Summary of LPO (a, b) and LHAa (c, d) macroconnections on a flatmap representation of the mouse brain (adapted from Hahn et al., 2021). The flatmaps are truncated at the spinal cord and do not include the retina (neither was analyzed). A mini brain flatmap (center inset) shows the spinal cord and is color‐coded for the other major brain divisions included in the larger flatmaps [key at bottom]). A 7‐point red‐pink color scale (key at bottom) represents the connection weight for positive data (present connections); negative data (absent connections) are indicated by dark gray. LPO and LHAa are colored bright green on their respective connection flatmaps. The data shown are mean average connection weights for each gray matter region across their analyzed atlas levels (shown in Figure 4 and reported in Supporting Information 1). Averages were calculated separately for connections ipsilateral or contralateral to unilateral tracer injections (all performed on the right side of the brain). For output connections (a, c; anterograde tracing data), analysis was performed using the same 7‐point qualitative scale; for input connections (b, d; retrograde tracing data), initial count data were assigned to one of seven bins representing the 7‐point qualitative scale, according to the number of counted labeled neurons (see Methods and Table 1 for additional details). A scalable vector graphics version of this figure is available as Supporting Information 2. An alternative flatmap representation showing the highest connection weights across atlas levels is also included in Supporting Information 2
