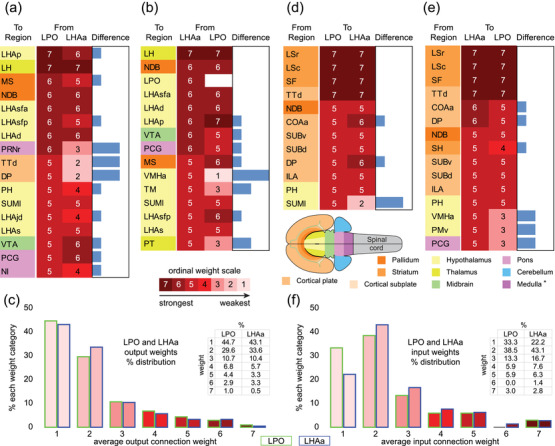
FIGURE 7.

Comparison of major LPO and LHAa connections. (a,b,d,e) LPO (a,d) and LHAa (b,e) output (a,b) and input (d,e) connections of moderately strong or stronger weight are compared and represented as a 7‐point ordinal scale. Blue bars (right columns) indicate individual region connection weight differences between LPO and LHAa. Background colors applied to region abbreviations (left columns) correspond to each region's major brain division (see flatmap insert with corresponding color key). An entry for an LPO self‐connection (at the target/tracer injection site) is left blank intentionally. (c,f) Histograms of average connection weights for LPO and LHAa outputs (c) and inputs (f). For abbreviations, see Supporting Information 1
