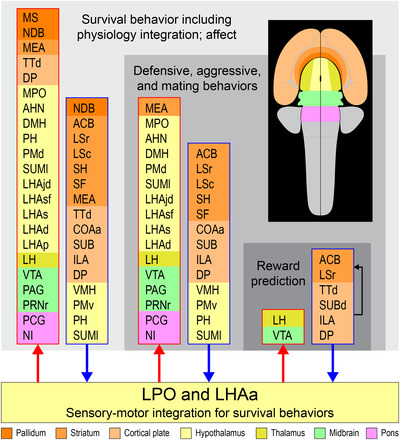
FIGURE 14.

Prominent multilevel LPO and LHAa functional associations suggested by a recent mammalian forebrain network model (Swanson et al., 2020). Three nested tiers of functional grouping are represented (gray shaded tiles), and for each is listed functional grouping‐related gray matter regions with prominent connections to LPO and LHAa; outputs and inputs are indicated, respectively, by red and blue colored lines and arrows. For the lowest tier represented, four regions of the cerebral cortex that are not directly associated with the indicated functional association of “reward prediction” are included because they provide robust inputs to LPO and LHAa as well as to the striatal regions within the same tier (indicated by the black arrow). Regions are color‐coded by tiles representing their major brain division (shown on the flatmap insert) and are listed in a topographic arrangement. See text for additional details. For abbreviations, see Supporting Information 1
