Figure 5.

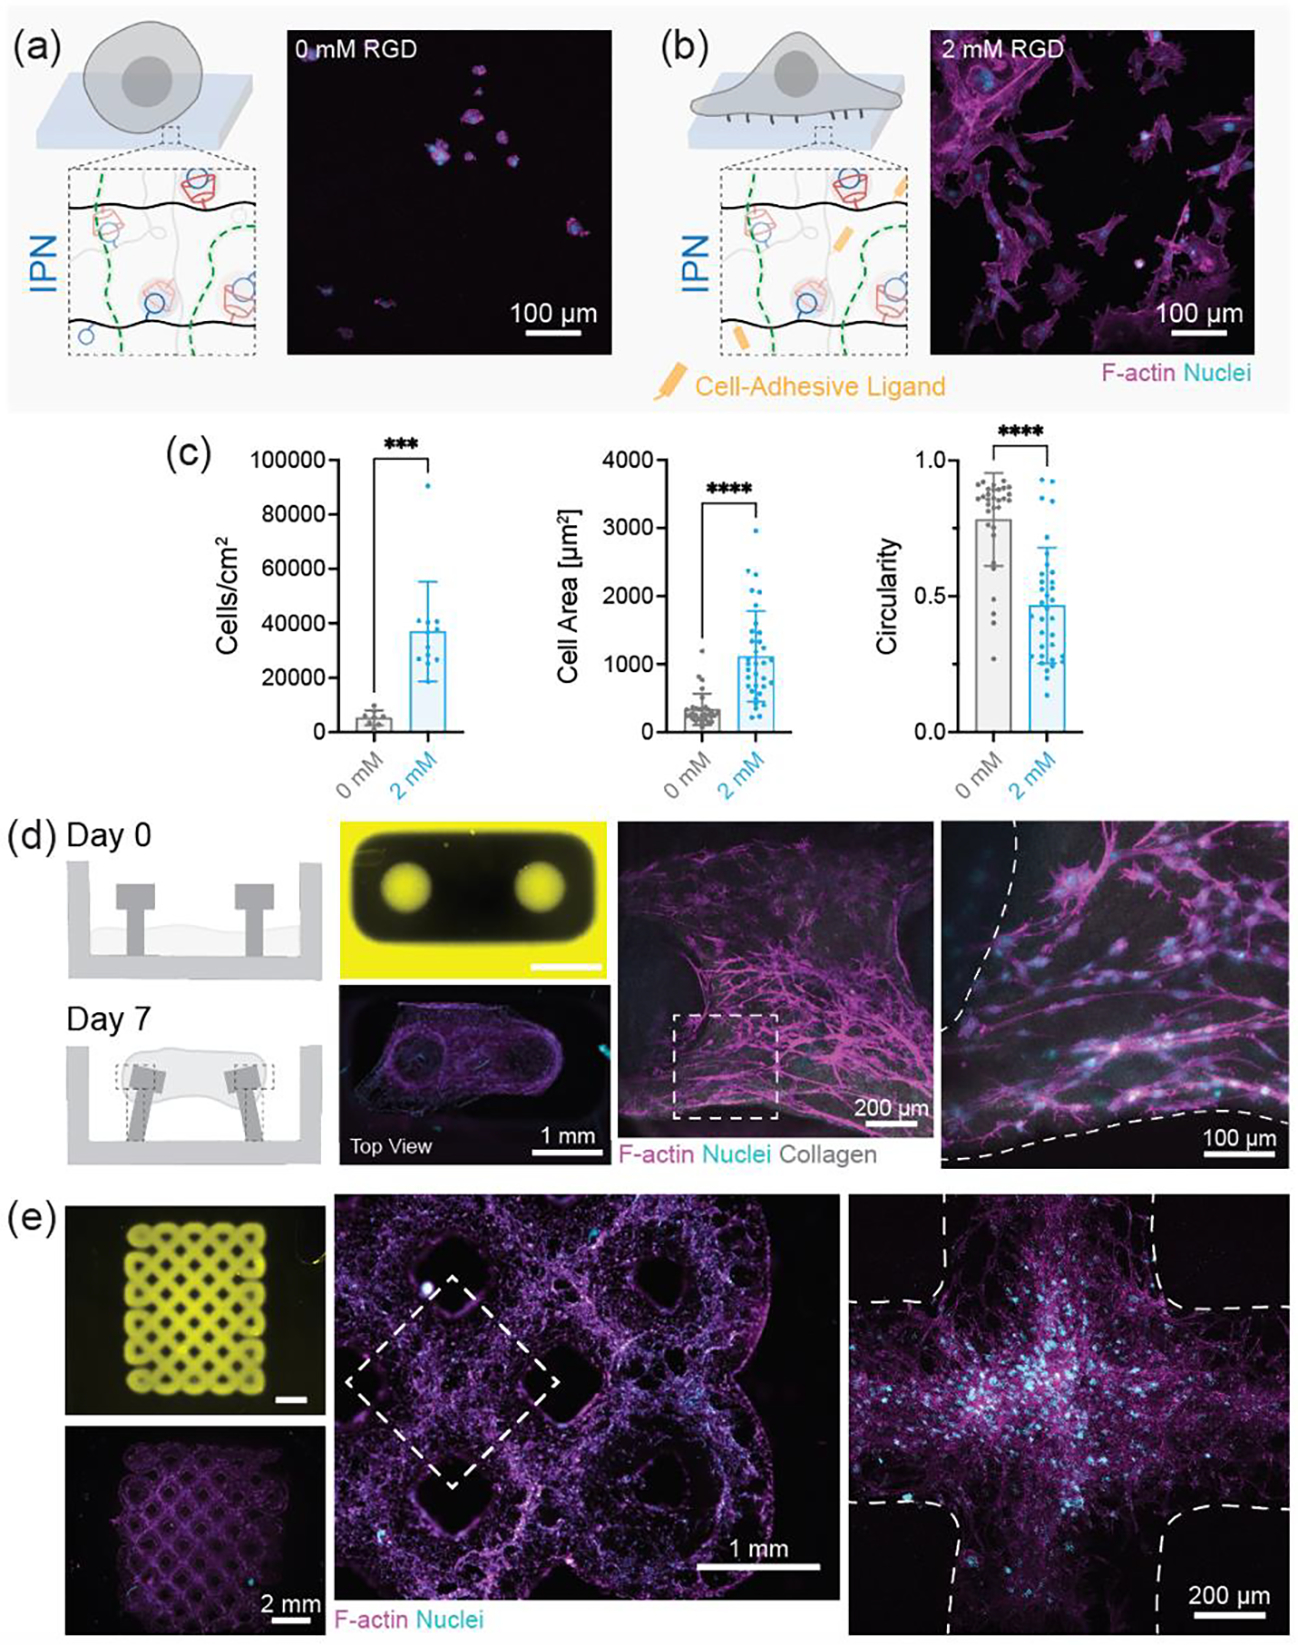
Cell interactions with 3D printed IPN hydrogels. Schematic representation and maximum projection image of 3T3 fibroblasts on IPN hydrogels with (a) 0 mM RGD (absence of cell adhesive ligands) and (b) 2 mM RGD (presence of cell adhesive ligands). Scale bars: 100 μm. (c) Quantification of the number of cells per unit area, cell spread area, and circularity of cells from (a) and (b). Data are reported as mean ± SD; n ≥ 8; ***p < 0.001; ****p < 0.0001 (two-tailed t-test). (d) Schematic representation of 3D printed mold for formation of collagen microtissue. Collagen gels seeded with fibroblasts at day 0 undergo contraction to form a dense tissue by day 7. Fluorescence images of 3D printed mold (yellow) at day 0 and tissue at day 7. Maximum projection images of microtissue to visualize cell morphology. Scale bars (left to right): 1 mm, 200 μm, and 100 μm. (e) Fluorescence images of 3D printed macroporous lattice (yellow) at day 0 and cellularization at day 1. Maximum projection images of lattice to visualize cell morphology. Scale bars (left to right): 2 mm, 1 mm, and 200 μm. F-actin (magenta), nuclei (cyan). IPN hydrogel composition was kept fixed at MeHA (0.6 wt.%) and NorHA GH (4.5 wt.%) for all studies
