
Figure 6.
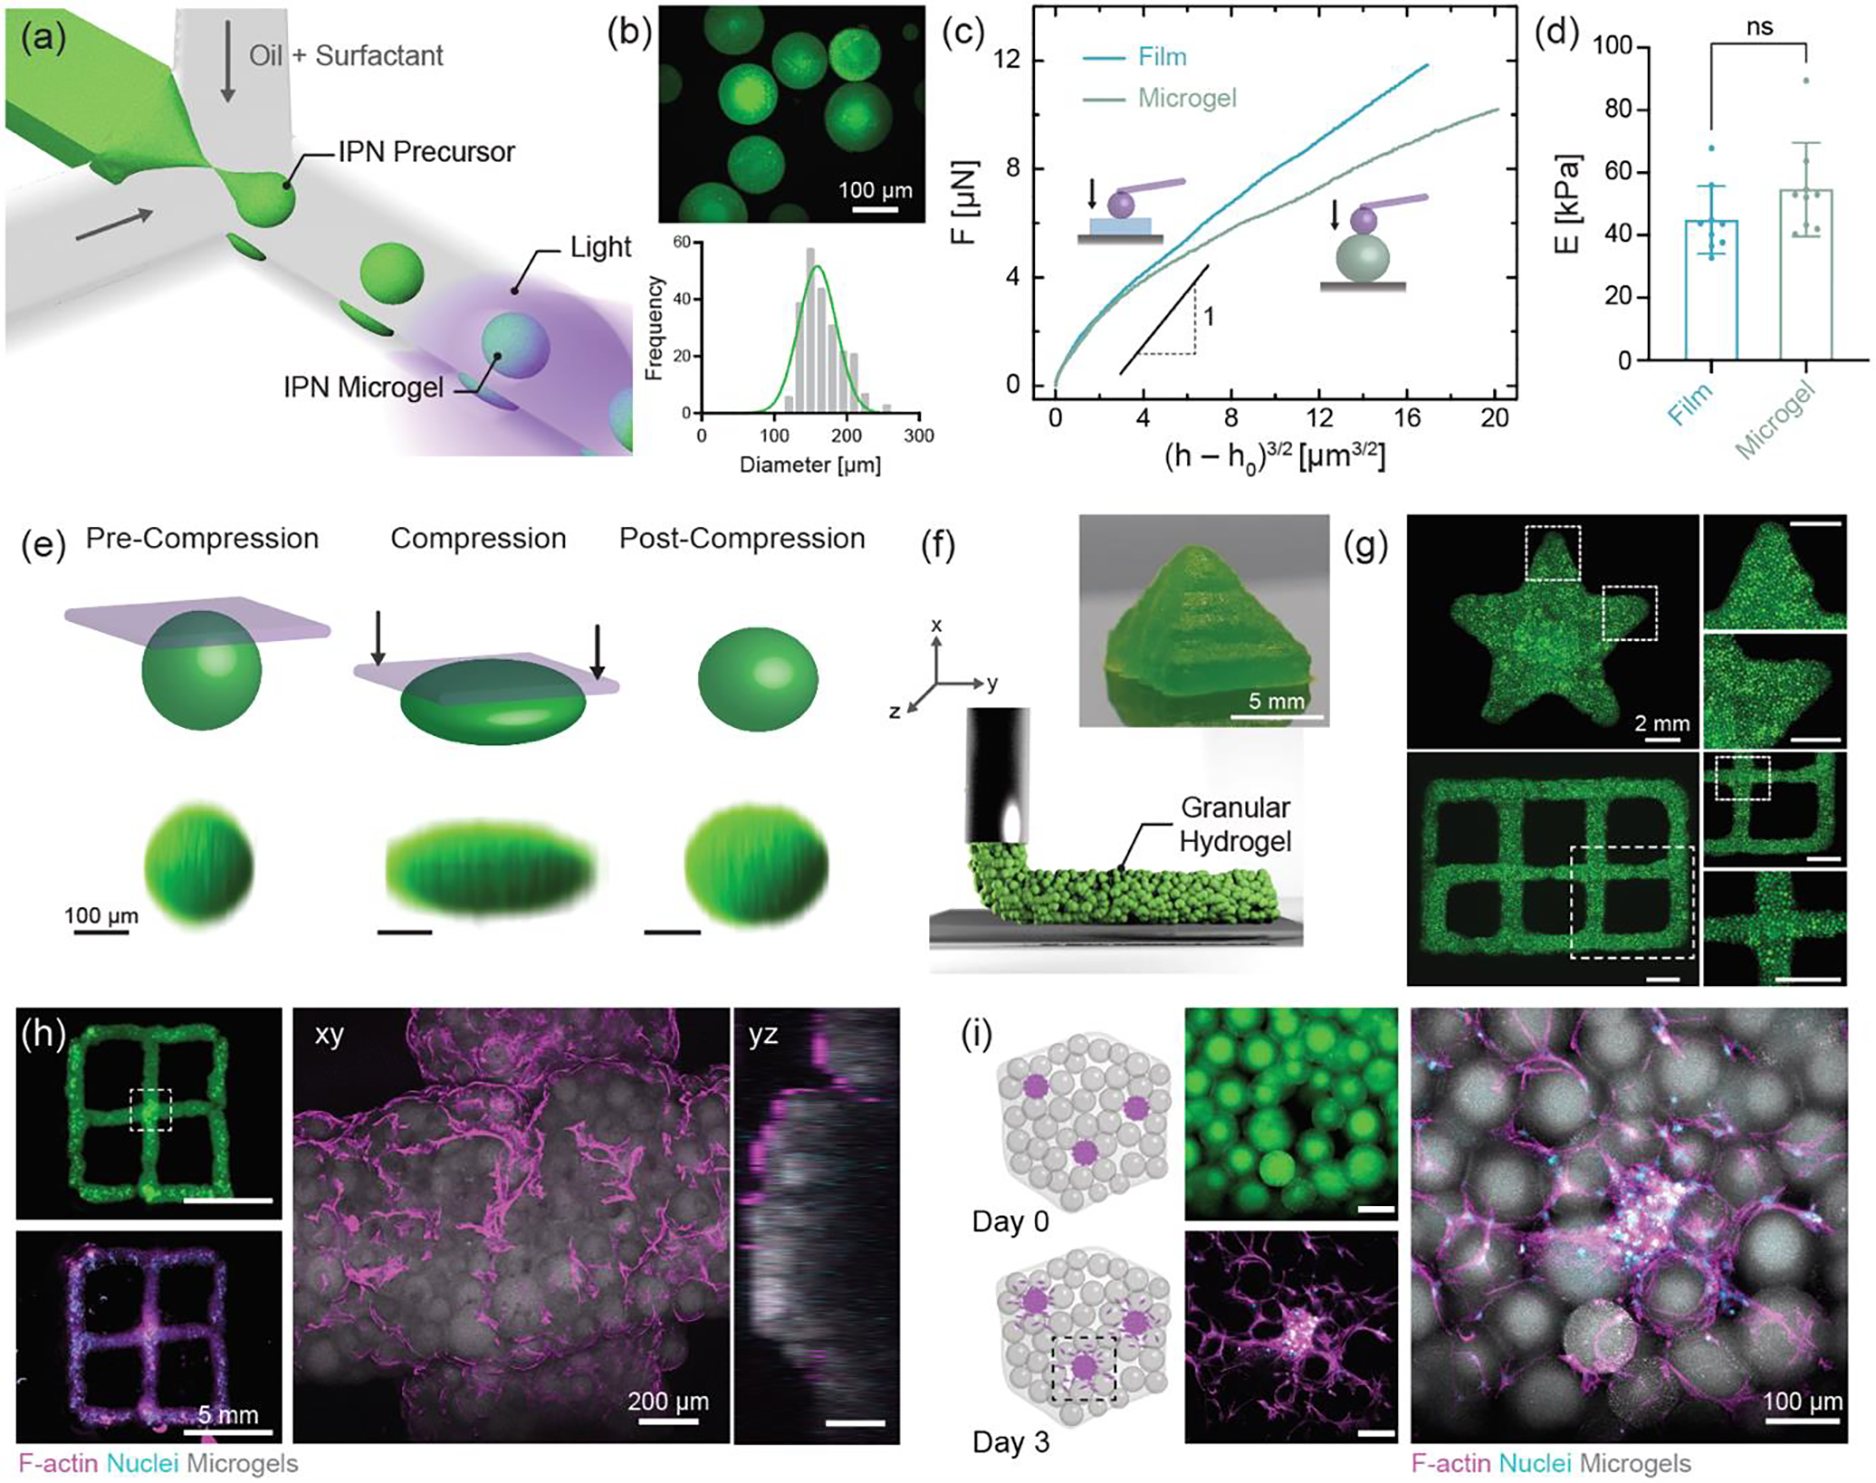
3D processing of IPN precursor into microparticles using one-step light triggered orthogonal reactions (a) Schematic representation of microfluidic fabrication of IPN microgels. (b) Fluorescence image and size distribution of IPN microgels. Scale bar: 100 μm. (c) Force (F) as a function of effective indentation, (h − h0)3/2 and (d) Young’s modulus (E) for casted IPN hydrogel films and IPN microgels. Data are reported as mean ± SD; n ≥ 8; ns = not significant (two-tailed t-test). Representative (e) shape-recovery of IPN microgel shown before, during (Force = 1.96 N), and after compression. Scale bar: 100 μm. (f) Schematic illustration of extrusion printing of jammed IPN microgel ink. Photograph of 3D printed pyramid from IPN microgel ink. Scale bar: 5 mm. (g) Fluorescence images of 3D printed star and lattice structures. Scale bar: 2 mm. (h) 3D printed lattice seeded with fibroblasts. Representative maximum projection image showing cell attachment and spreading at day 1. F-actin (magenta), nuclei (cyan), and microgels (gray). Scale bars: 5 mm and 200 μm. (i) Schematic illustration of hMSC/HUVEC spheroids encapsulated in a 3D granular hydrogel. Cell outgrowth seen from spheroids at day 3. Scale bar: 100 μm. IPN hydrogel composition is kept fixed at MeHA (0.6 wt.%) and NorHA GH (4.5 wt.%) for all studies.