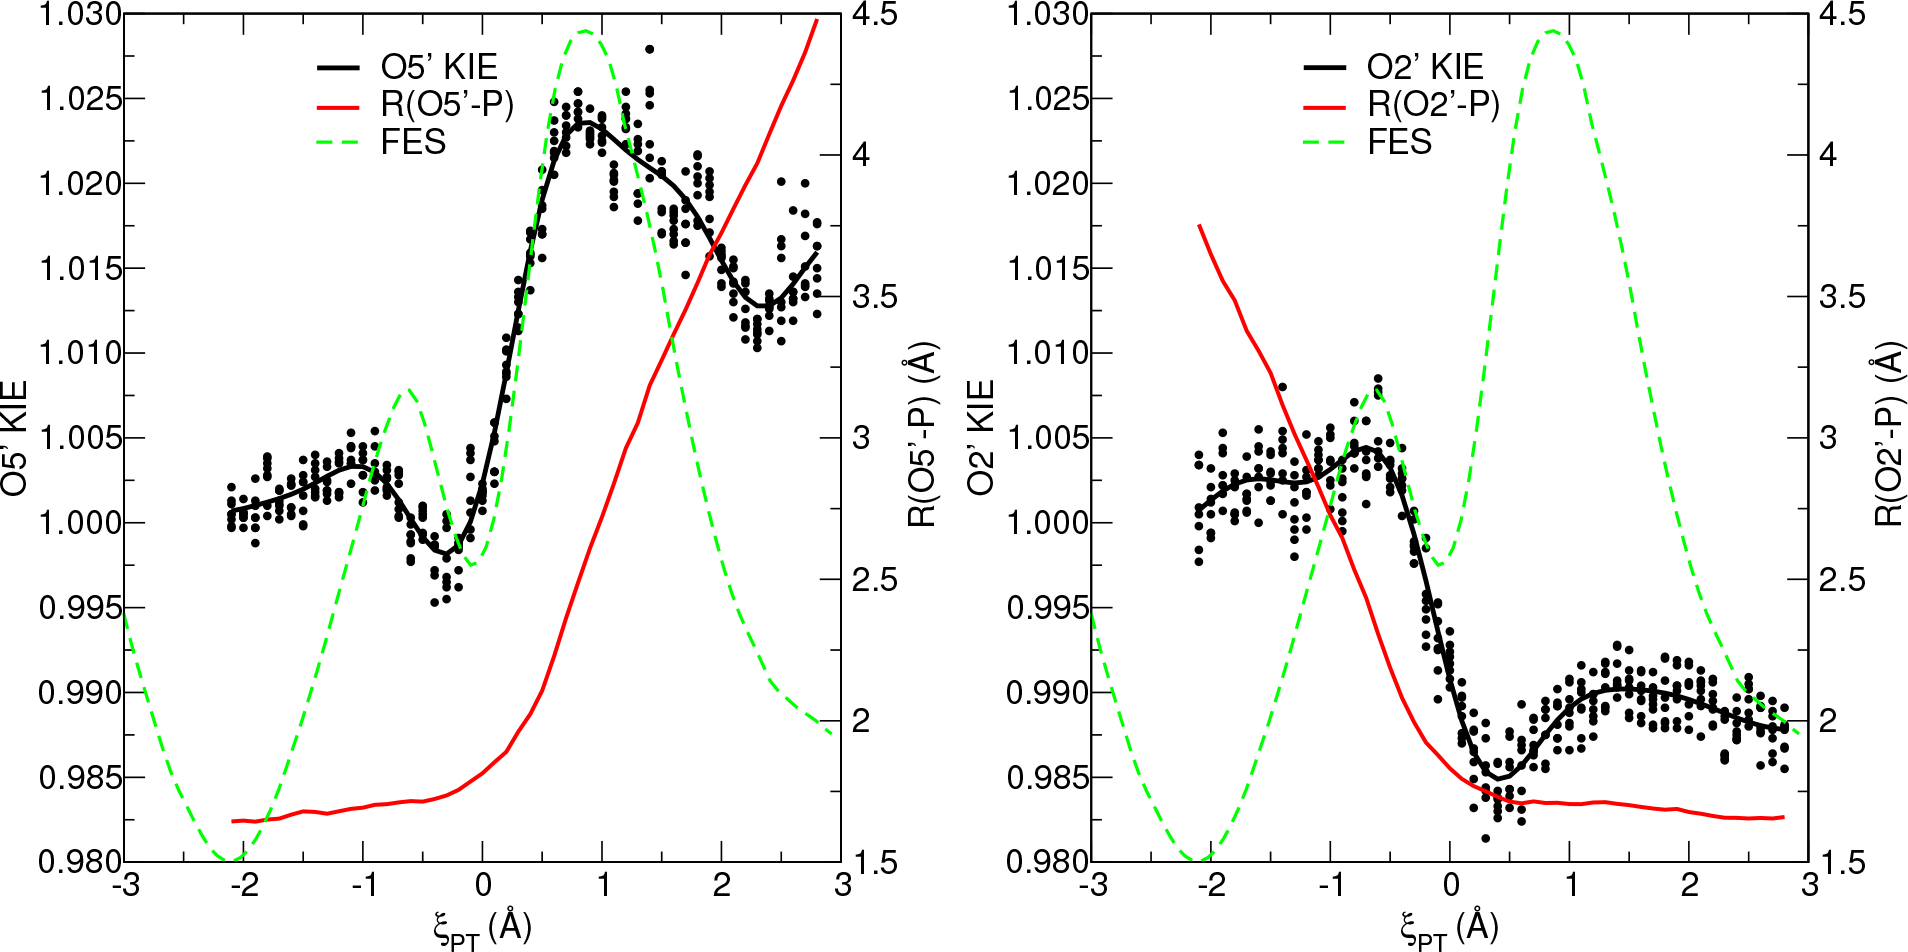
Figure 4:

The O5′ and O2′ TD-FEP KIE values of the native reaction as a function of collective variable defining the position of the effective transition state. The solid black line is a fit through the KIE values. The red line is the average value of covalent bond length. The green line is an overlay of the FES.
