
Figure 3: Broad-Spectrum Antibiotic Pre-exposure Disrupts Lymphocyte-Derived Cytokine Responses within the Gastrointestinal Tract During Invasive Fungal Infection.
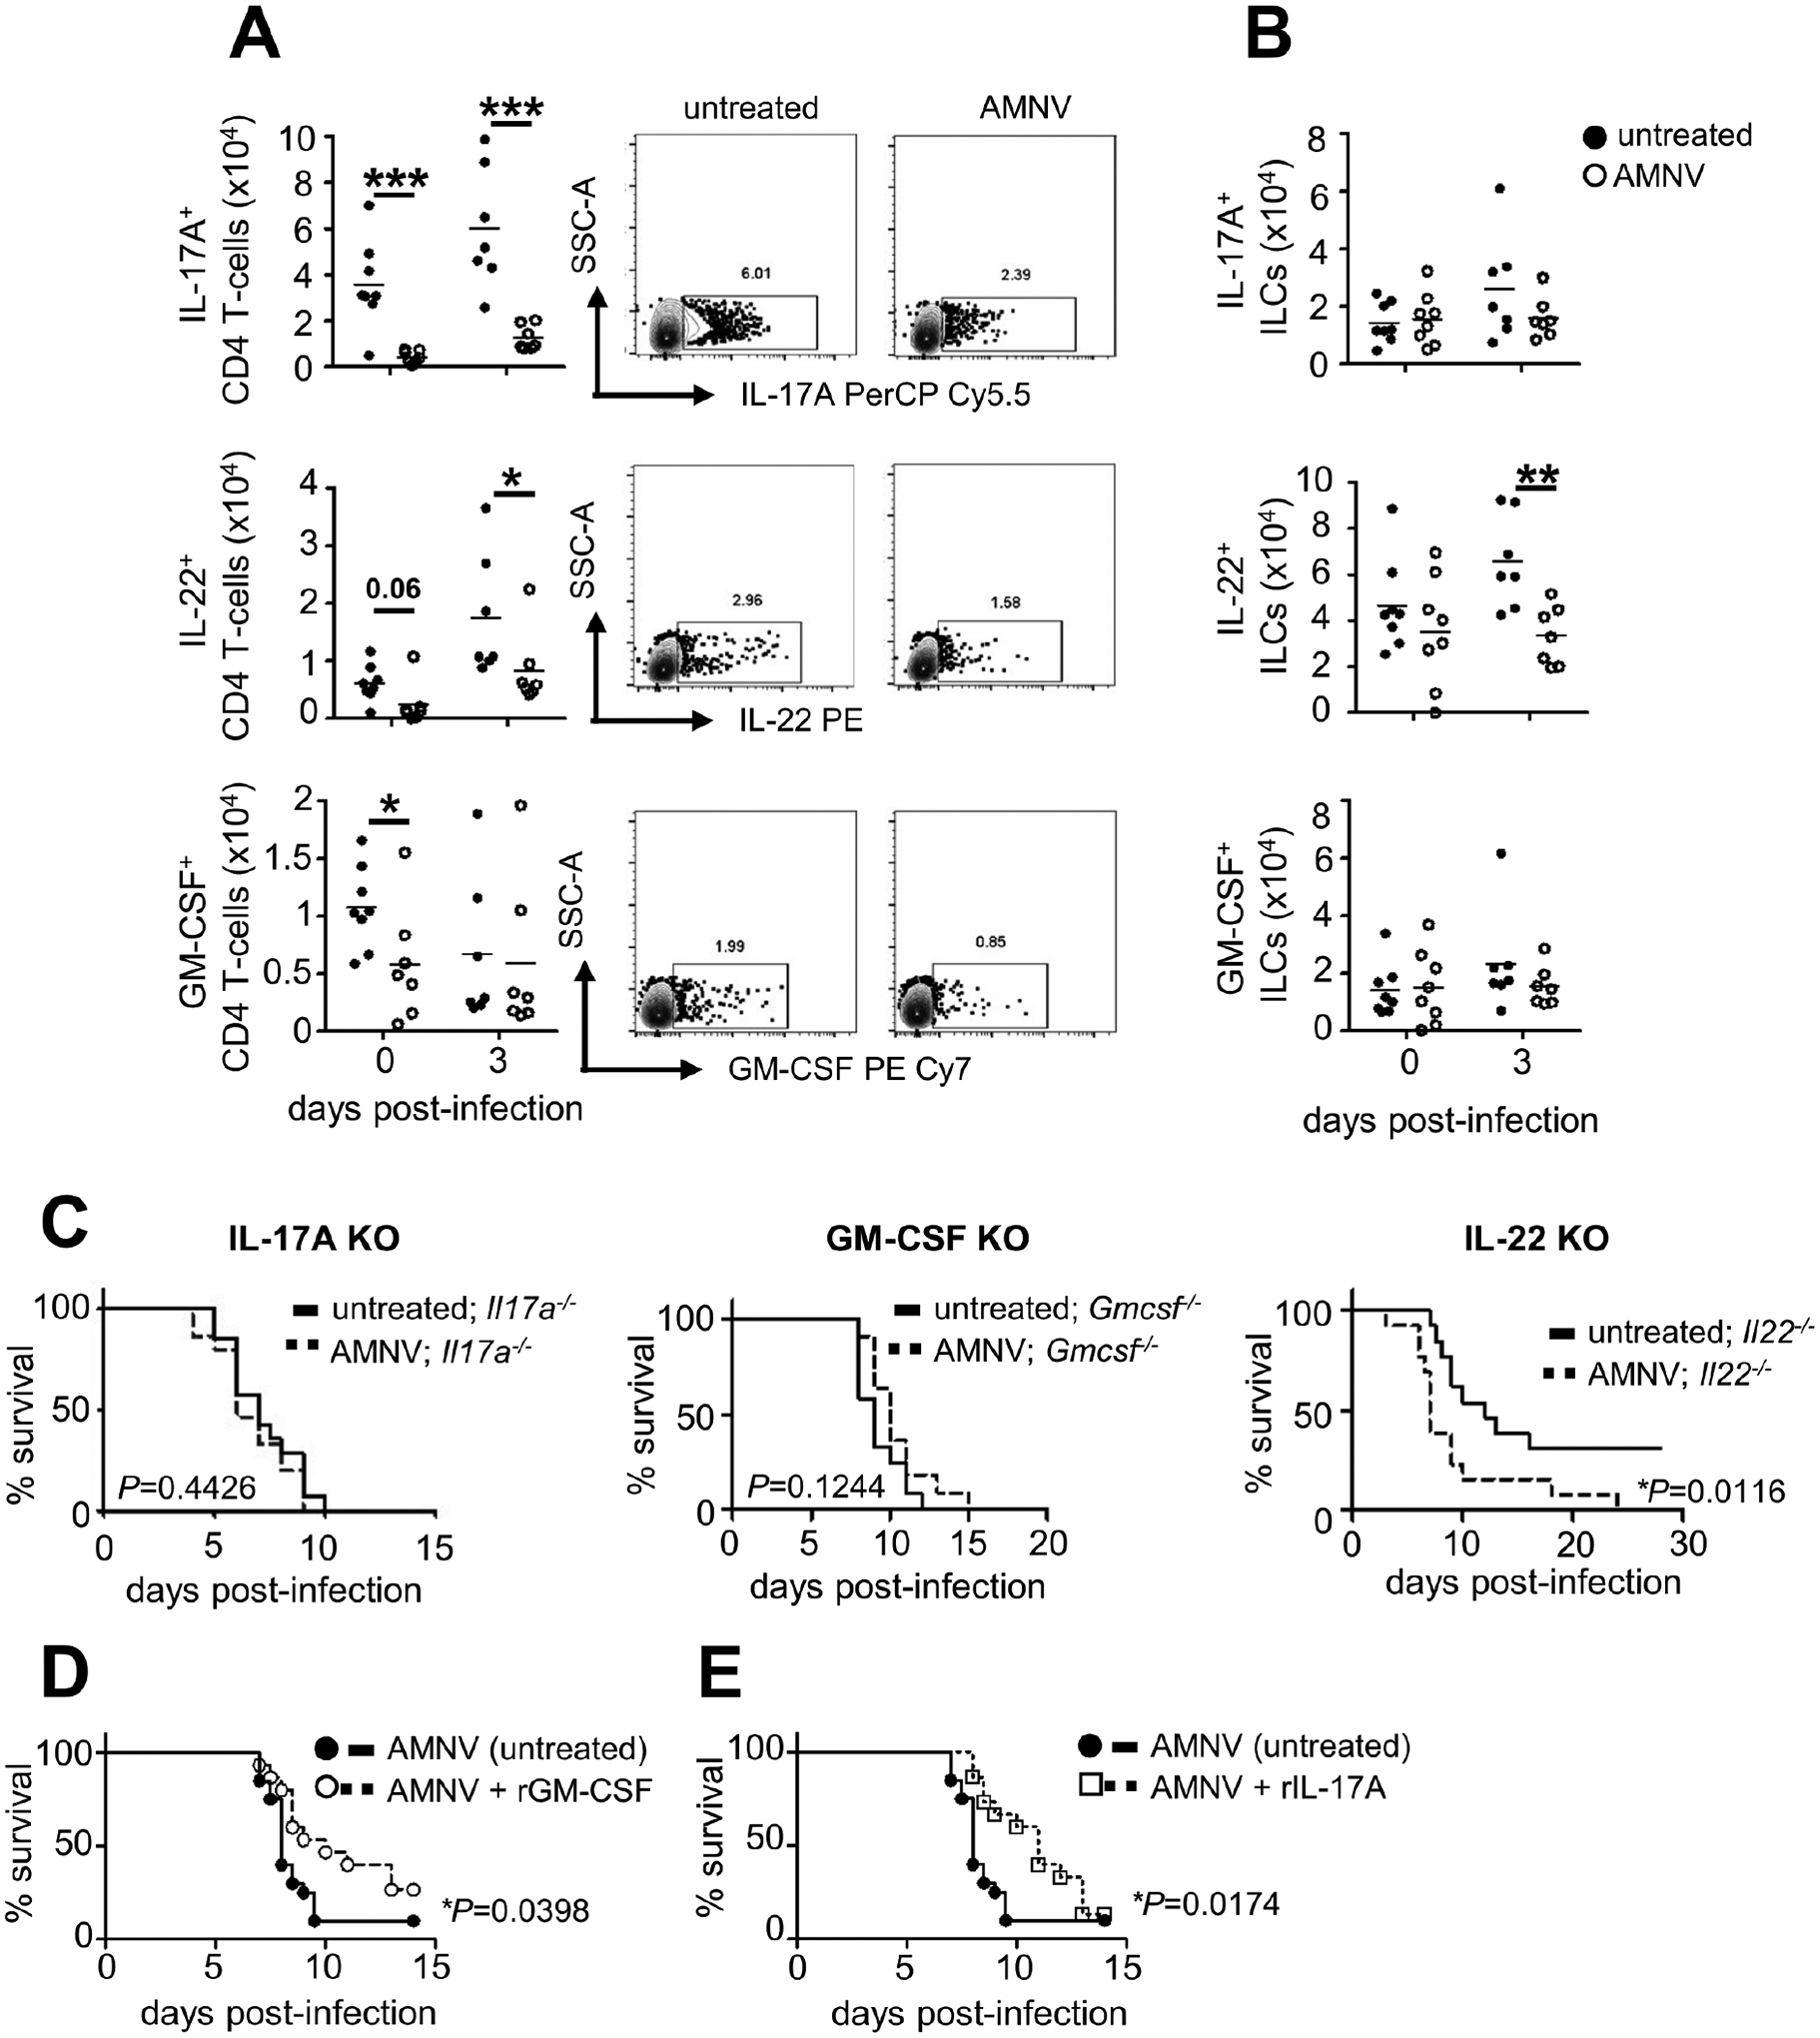
(A and B) (A) Numbers of cytokine-positive CD4+ T cells and (B) ILCs in untreated (day 0 n=8; day 3 n=7) and AMNV pre-exposed (day 0 n=8; day 3 n=7) mice at indicated time points relative to fungal infection. Example FACS plots are gated on CD4+ T cells using the gating strategy shown in Fig. S6. All data shown is pooled from 2 independent experiments; each point represents an individual animal. Data is analyzed by unpaired two-tailed t-tests.
(C) Survival curve of C. albicans-infected Il17a−/− (untreated, n=14; AMNV pre-exposed, n=15), Gmcsf−/− (untreated, n=12; AMNV pre-exposed, n=11) and Il22−/− (untreated, n=13; AMNV pre-exposed, n=13) mice. Data in each curve is from 3 (Il17a−/−) or 2 (Gmcsf−/−, Il22−/−) independent experiments and analyzed by Log rank Mantel-Cox test.
(D and E) (D) Survival curve of C. albicans-infected AMNV pre-exposed WT mice, with or without administration of recombinant GM-CSF, or (E) recombinant IL-17A (untreated n=20 mice, treated n=15 mice). WT mice were pre-exposed to AMNV as in Fig 1A, and 5 μg GM-CSF or 1 μg IL-17A or diluent control was delivered intraperitoneally, using the following dosing strategy: GM-CSF, days −6, −4, −2, 0, +2, +4 and +6 relative to C. albicans infection; IL-17A, −8 hours and +24 hours relative to C. albicans infection. Data in D and E is pooled from 2 independent experiments and analyzed by Log rank Mantel-Cox test. *P<0.05, **P<0.01, ***P<0.005, ****P<0.0001.