
Figure 4. Oleate binding to Cytoglobin distal histidine mutants in the presence of imidazole determined by differential spectroscopy.
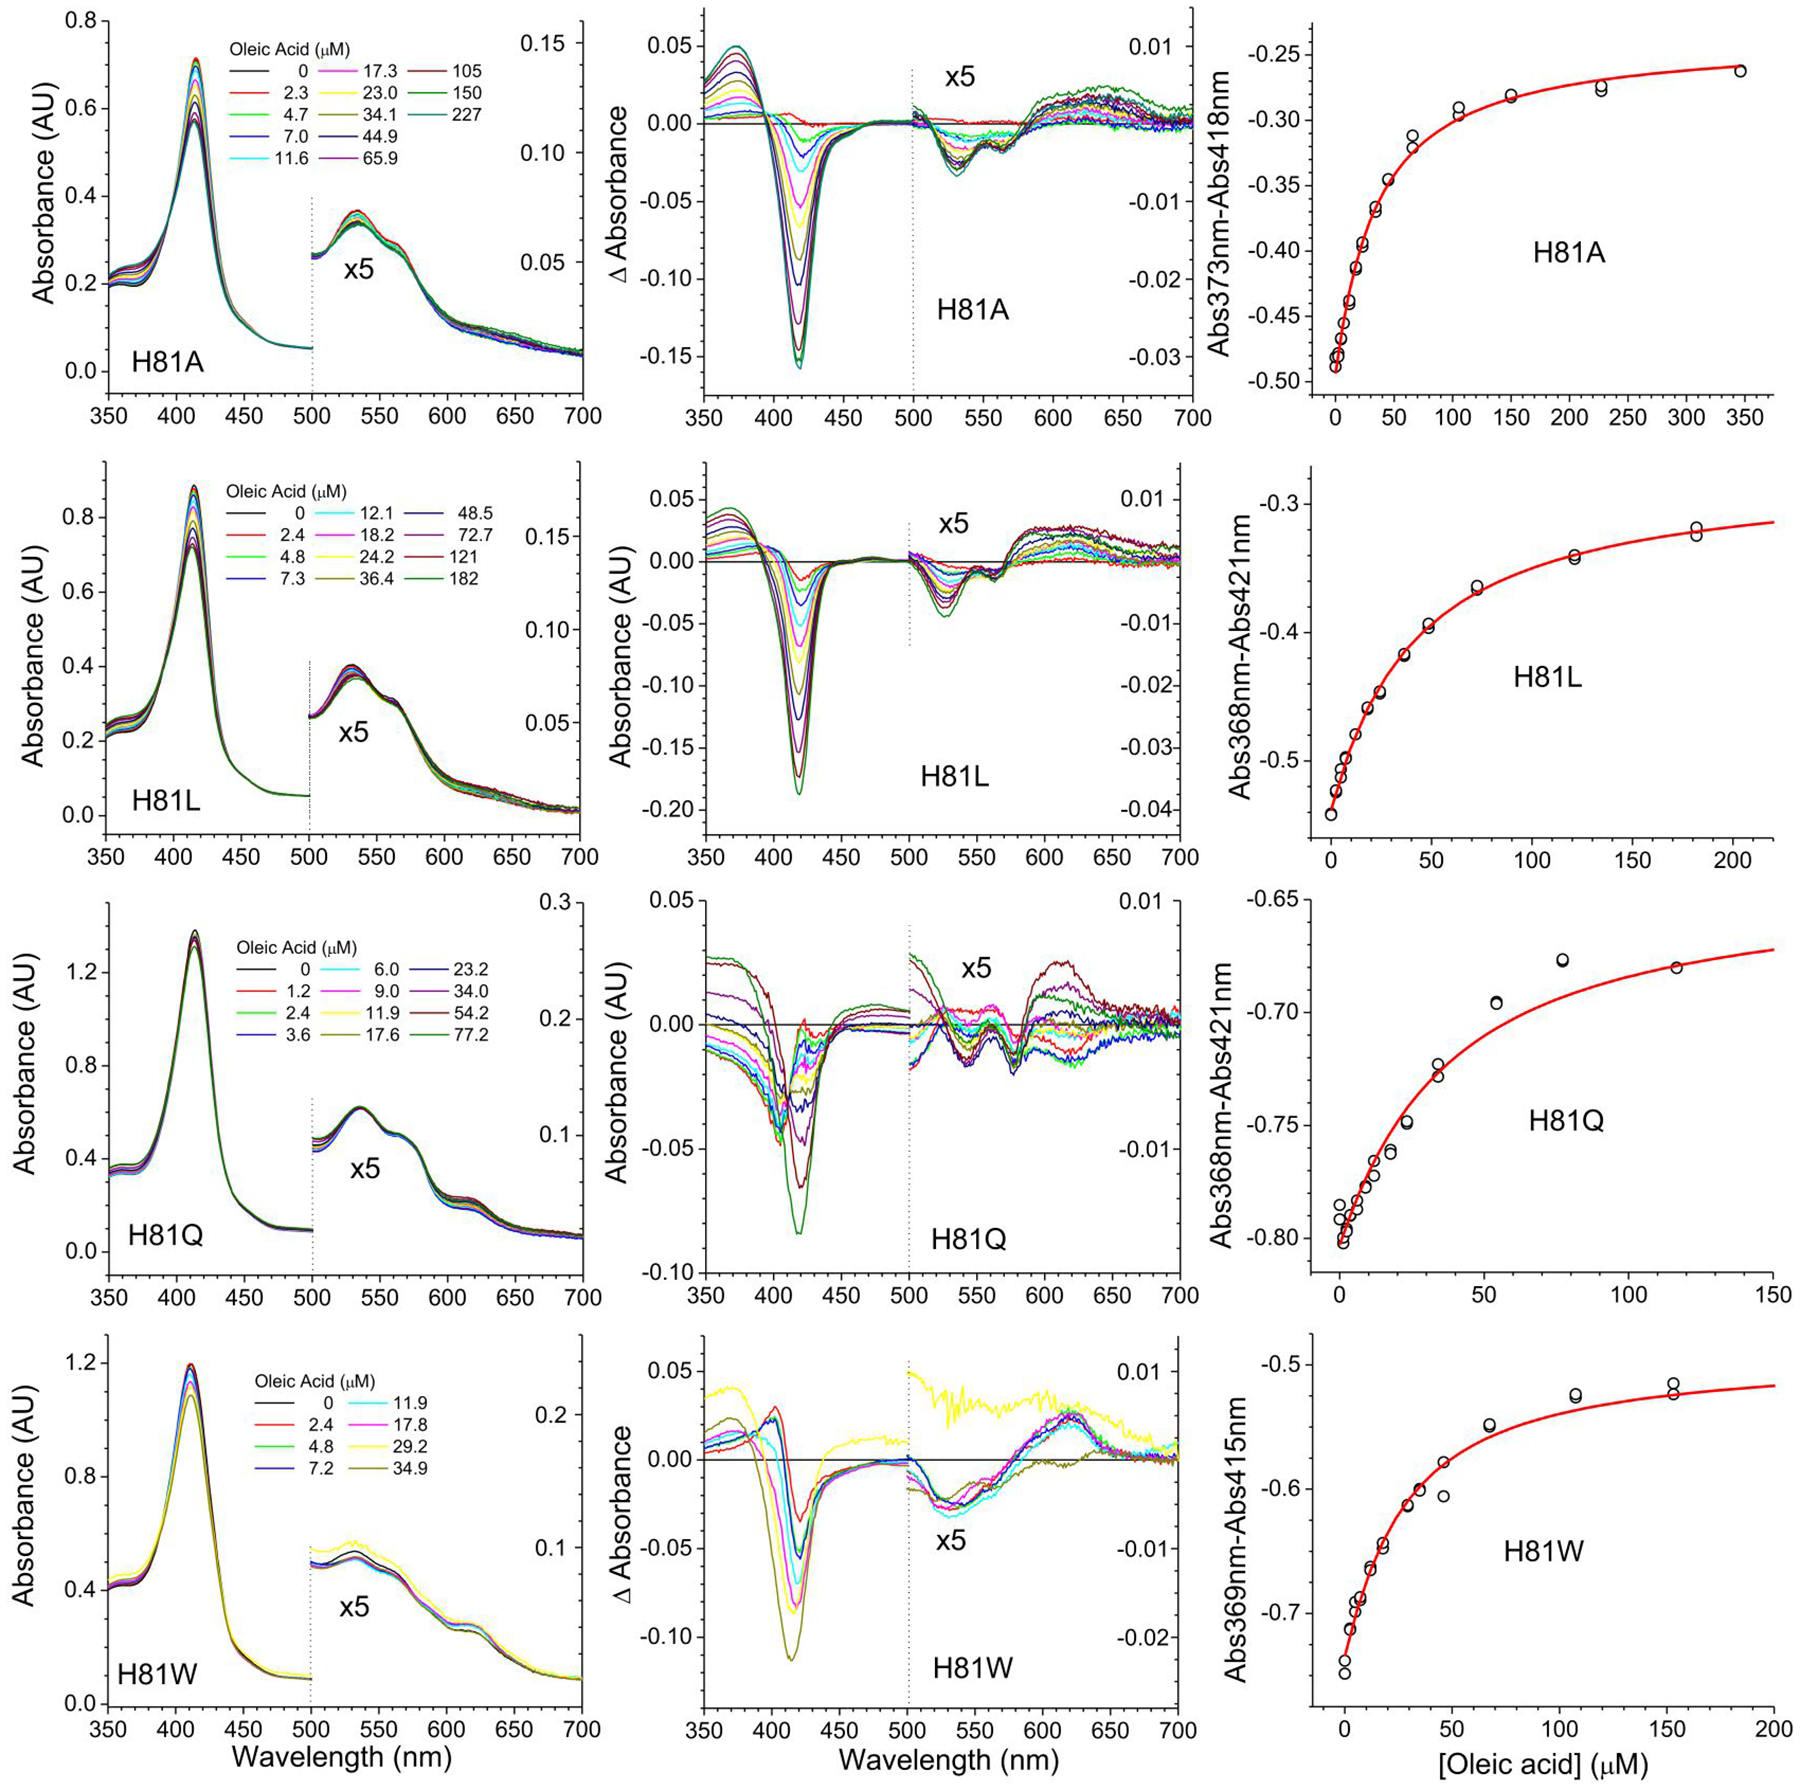
The binding of oleate was monitored in the presence of 250 μM Imidazole. Left panels indicate the absorbance changes upon addition of increasing amounts of oleate. The concentrations of oleate are indicated in each panel. Middle panels show the difference spectra -subtracting the initial spectrum from each spectrum. Right panels show the fit to determine the apparent KD values by fitting the absorbance differences at the wavelengths showing the largest absorbance change versus the concentration of oleate. The red line denotes the fit of the data to Equation 1. The 500 nm-700 nm range in the left and middle panels is enlarged to show the spectral changes in detail.