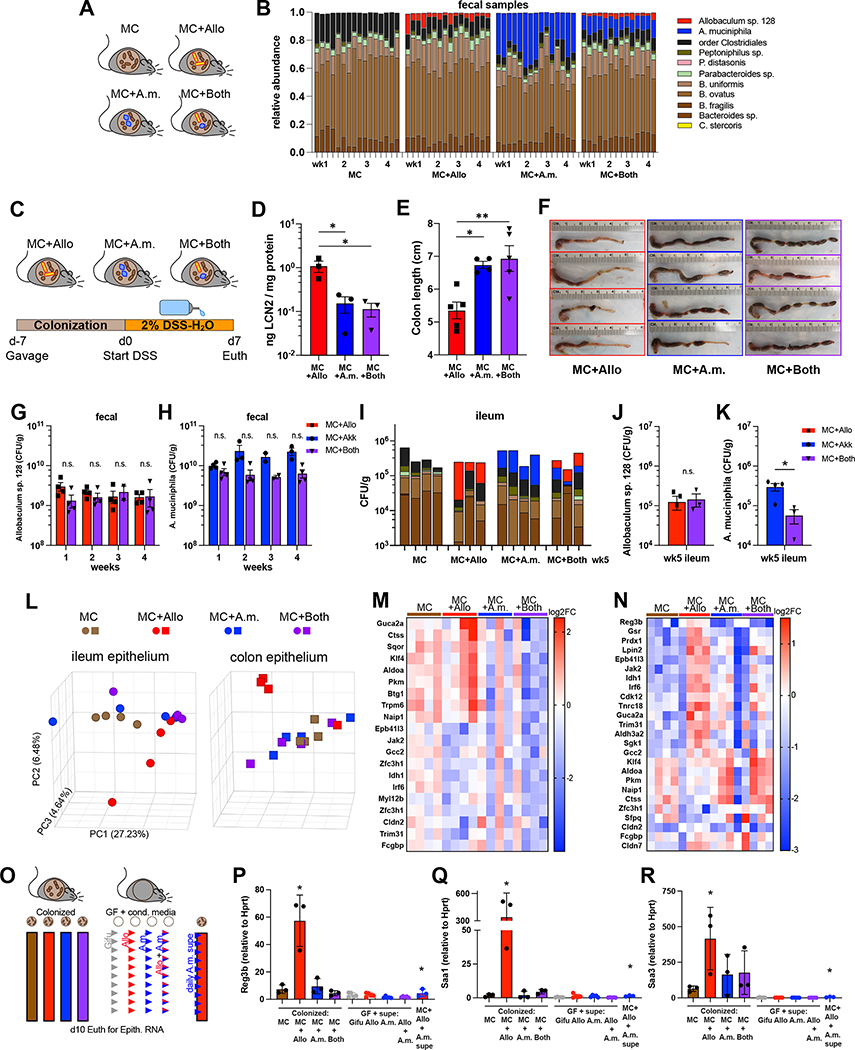
Figure 4. A. muciniphila attenuates Allobaculum sp. 128-mediated intestinal epithelial cell activation and colitis.
(A) Experimental schematic. (B) Fecal microbiota composition profiled over four weeks (n=3–4 mice/group). (C) Experimental schematic for DSS colitis. (D) d2 fecal lipocalin and (E-F) colon length at euthanasia. (G-K) Absolute quantitative microbial profiling. (L) Principal component analysis (PCA) of gene expression in intestinal epithelial cells (IEC) after 2 weeks of colonization. (M-N) Log2 fold change of the top differentially expressed genes. (O) Experimental schematic: colonization with live commensal microbes or daily gavage with sterile culture supernatant for 10 days before RNA harvest from IEC. (P-R) Ileal IEC expression of key Allobaculum-induced genes. Error bars show mean ± SEM. Welch’s t-test was used to compare across MC+Allo+A.m.supe vs MC+Allo; * P<0.05, ** P<0.01. Data shown in (D-F) are one representative of N=2 experiments. Data shown in (A), (G-K), (L-N), and (O-R) are each from separate N=1 experiments.

