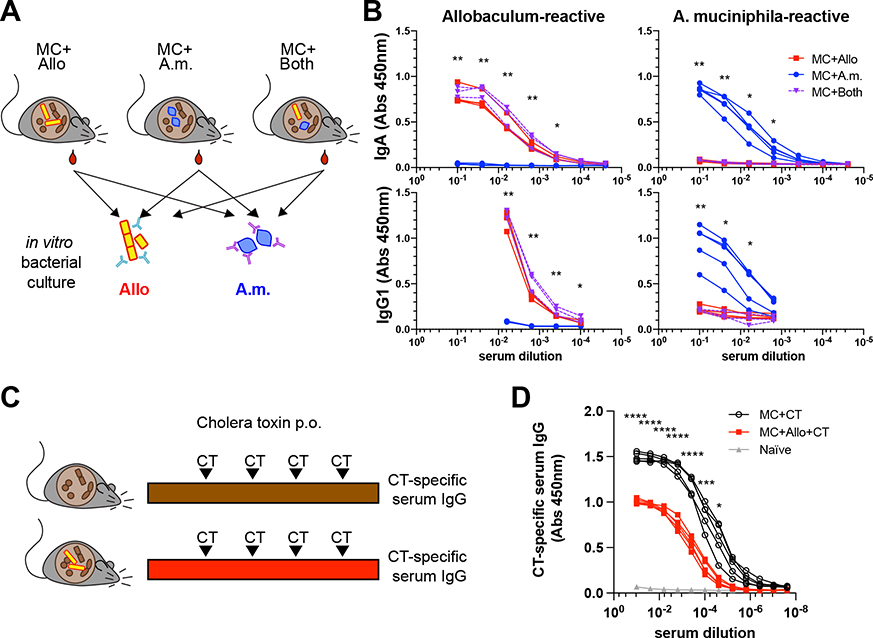
Figure 6. Allobaculum sp. 128 blunts antigen-specific serum antibody responses to A. muciniphila and oral vaccination.
(A) Experimental schematic. (B) Dilution curves of A. muciniphila-reactive and Allobaculum sp. 128-reactive serum IgA & IgG1 (n=3–5). (C-D) Cholera toxin (CT)-specific serum IgG at 5 weeks. Error bars show mean ± SEM. Welch’s t-test was used to compare MC+A.m. to MC+Both at each dilution. * P<0.05, ** P<0.01, *** P<0.001, **** P<0.0001. Data shown in (B) are representative from one of N=4 independent experiments. Data shown in (D) are from N=1 experiment.

