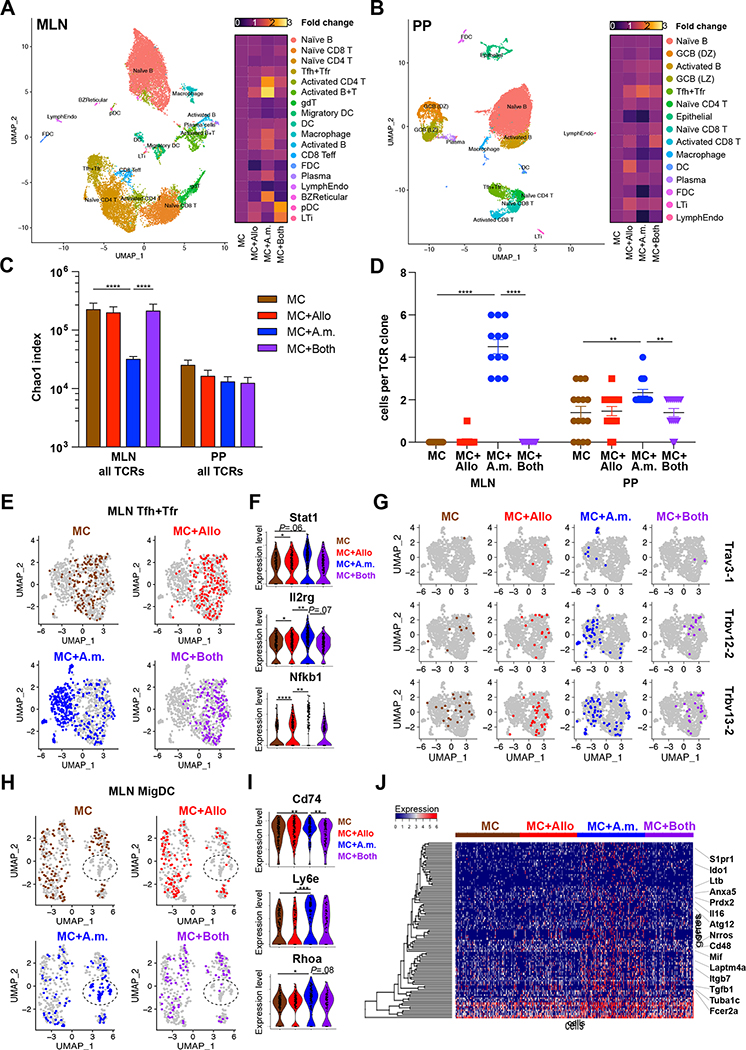
Figure 7. Allobaculum sp. 128 and A. muciniphila induce context-dependent transcriptomic reprogramming in mucosal lymphoid tissues.
(A-B) Annotated dimensionality reduction plots of single-cell gene expression libraries, pooled by tissue (A, MLN; B, PP). Right, heatmap of cell lineage relative frequency normalized to MC. (C) TCR repertoire diversity. (D) Top 12 most expanded clonotypes in MC+A.m. mice. (E,H) MLN Tfh+Tfr and MigDC were re-clustered and highlighted by microbiome. (F) Expression of key genes within Tfh+Tfr. (G) Prominent TCR clonotypes within MLN Tfh+Tfr induced by MC+A.m. (H) MLN MigDC UMAP clustering. (I) Expression of key MigDC antigen presentation genes. (J) Top 100 differentially expressed genes within MLN MigDC transcriptomes. Error bars show mean ± SEM. Welch’s t-test was used to compare gene expression across microbiome groups. * P<0.05, ** P<0.01, *** P<0.001, **** P<0.0001. Data shown from N=1 experiment with n=3 mice/group, pooled.

