
Figure 1. Distinct intraepithelial T cell dynamics post enteric viral infections.
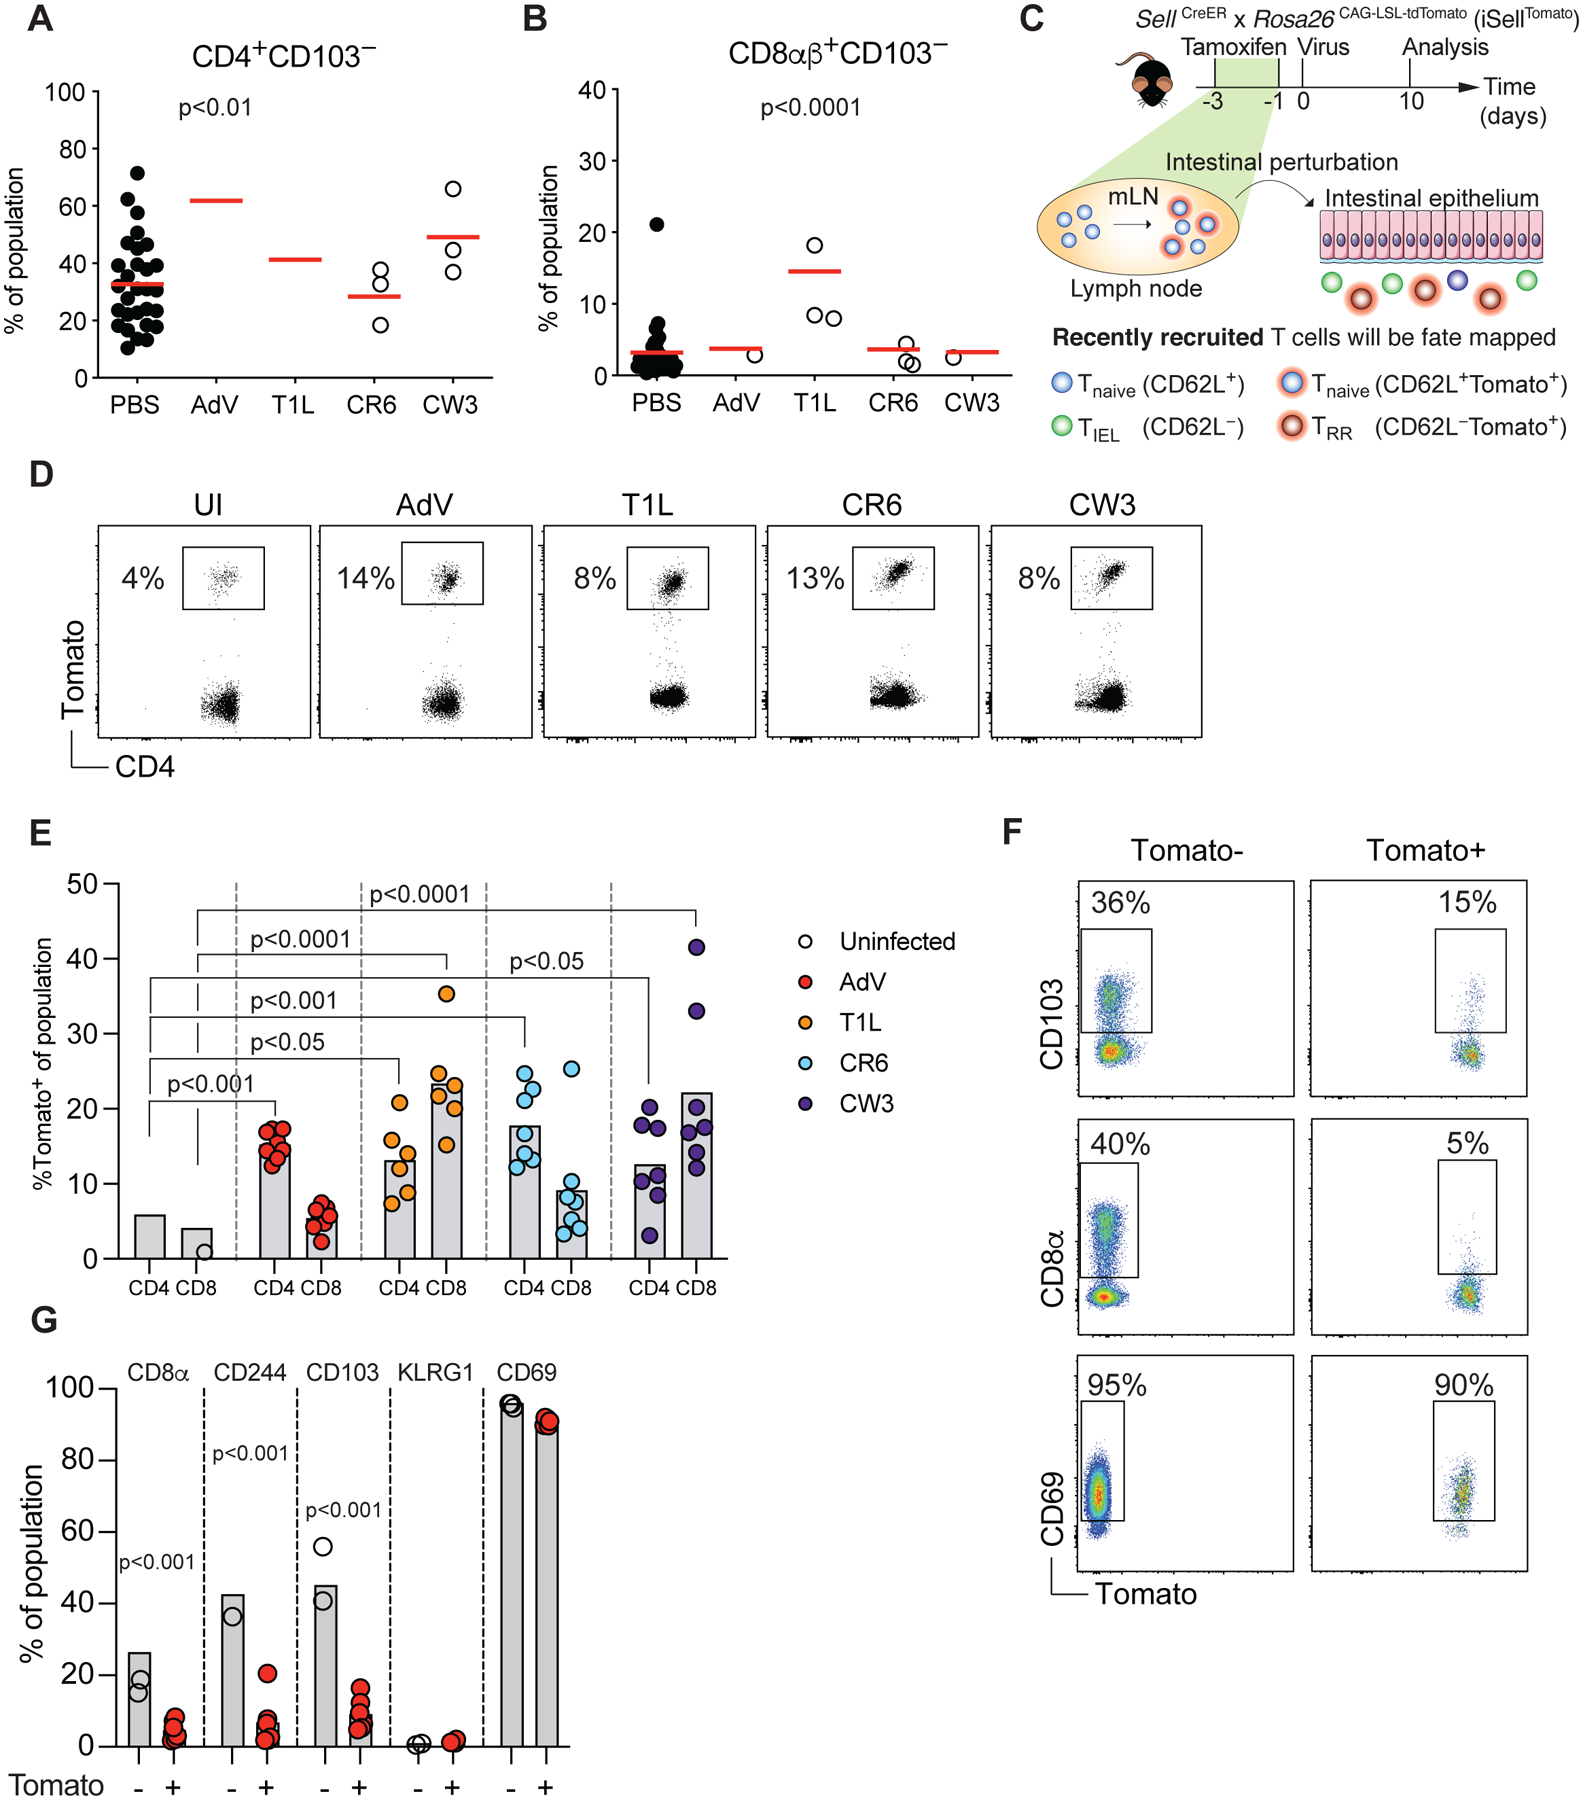
(A-B) B6 mice were orally infected with 107 infectious units (i.u.) of murine adenovirus-2 (AdV), 108 plaque forming units (pfu) of reovirus T1L, 3×10⁶ pfu of either murine norovirus (MNV) CR6 or CW3. CD4+CD103− (A) or CD8αβ+CD103− (B) small intestine intraepithelial lymphocytes (IEL) were analyzed 10 days post infection among total CD4 or CD8αβ T cells, respectively. (C) Experimental overview of the T cell fate-mapping model. iSellTomato mice were treated orally with tamoxifen 1 and 3 days prior to viral infection, RR: recently recruited. (D-E) iSellTomato mice were orally infected with 107 i.u. of AdV, 108 pfu of T1L, or 3×10⁶ pfu of either CR6 or CW3, small intestine TCRβ+CD4+CD62L− and TCRβ+CD8αβ+CD62L− IELs were analyzed for tomato expression 10 days post infection. (D) Representative dot plots of tomato expression among CD4+ IELs. (E) Frequencies of tomato expression among small intestine CD4+ or CD8+ IELs. (F-G) iSellTomato mice were infected with 107 i.u. of AdV and expression of CD103, CD8α and CD69 were analyzed among TCRβ+CD4+CD62L−Tomato+ or Tomato− cells. (F) Representative surface expression of markers as indicated among Tomato+ and Tomato− T cells. (G) Frequencies of Tomato+ or Tomato− cells expressing the indicated markers. Data are expressed as mean of individual mice in A and B (n = 6 for AdV, n = 5 for T1L, n = 12 for CR6, of two independent experiments, n = 3 for CW3, of one experiment), in E (n = 8 for AdV, n = 6 for CW3 and n = 7 for CR6 and T1L, of two independent experiments) and in G (n = 6 of two independent experiments). p values are as indicated, one-way ANOVA plus Bonferroni test in A and E, Student’s t-test in G. See also Figure S1.