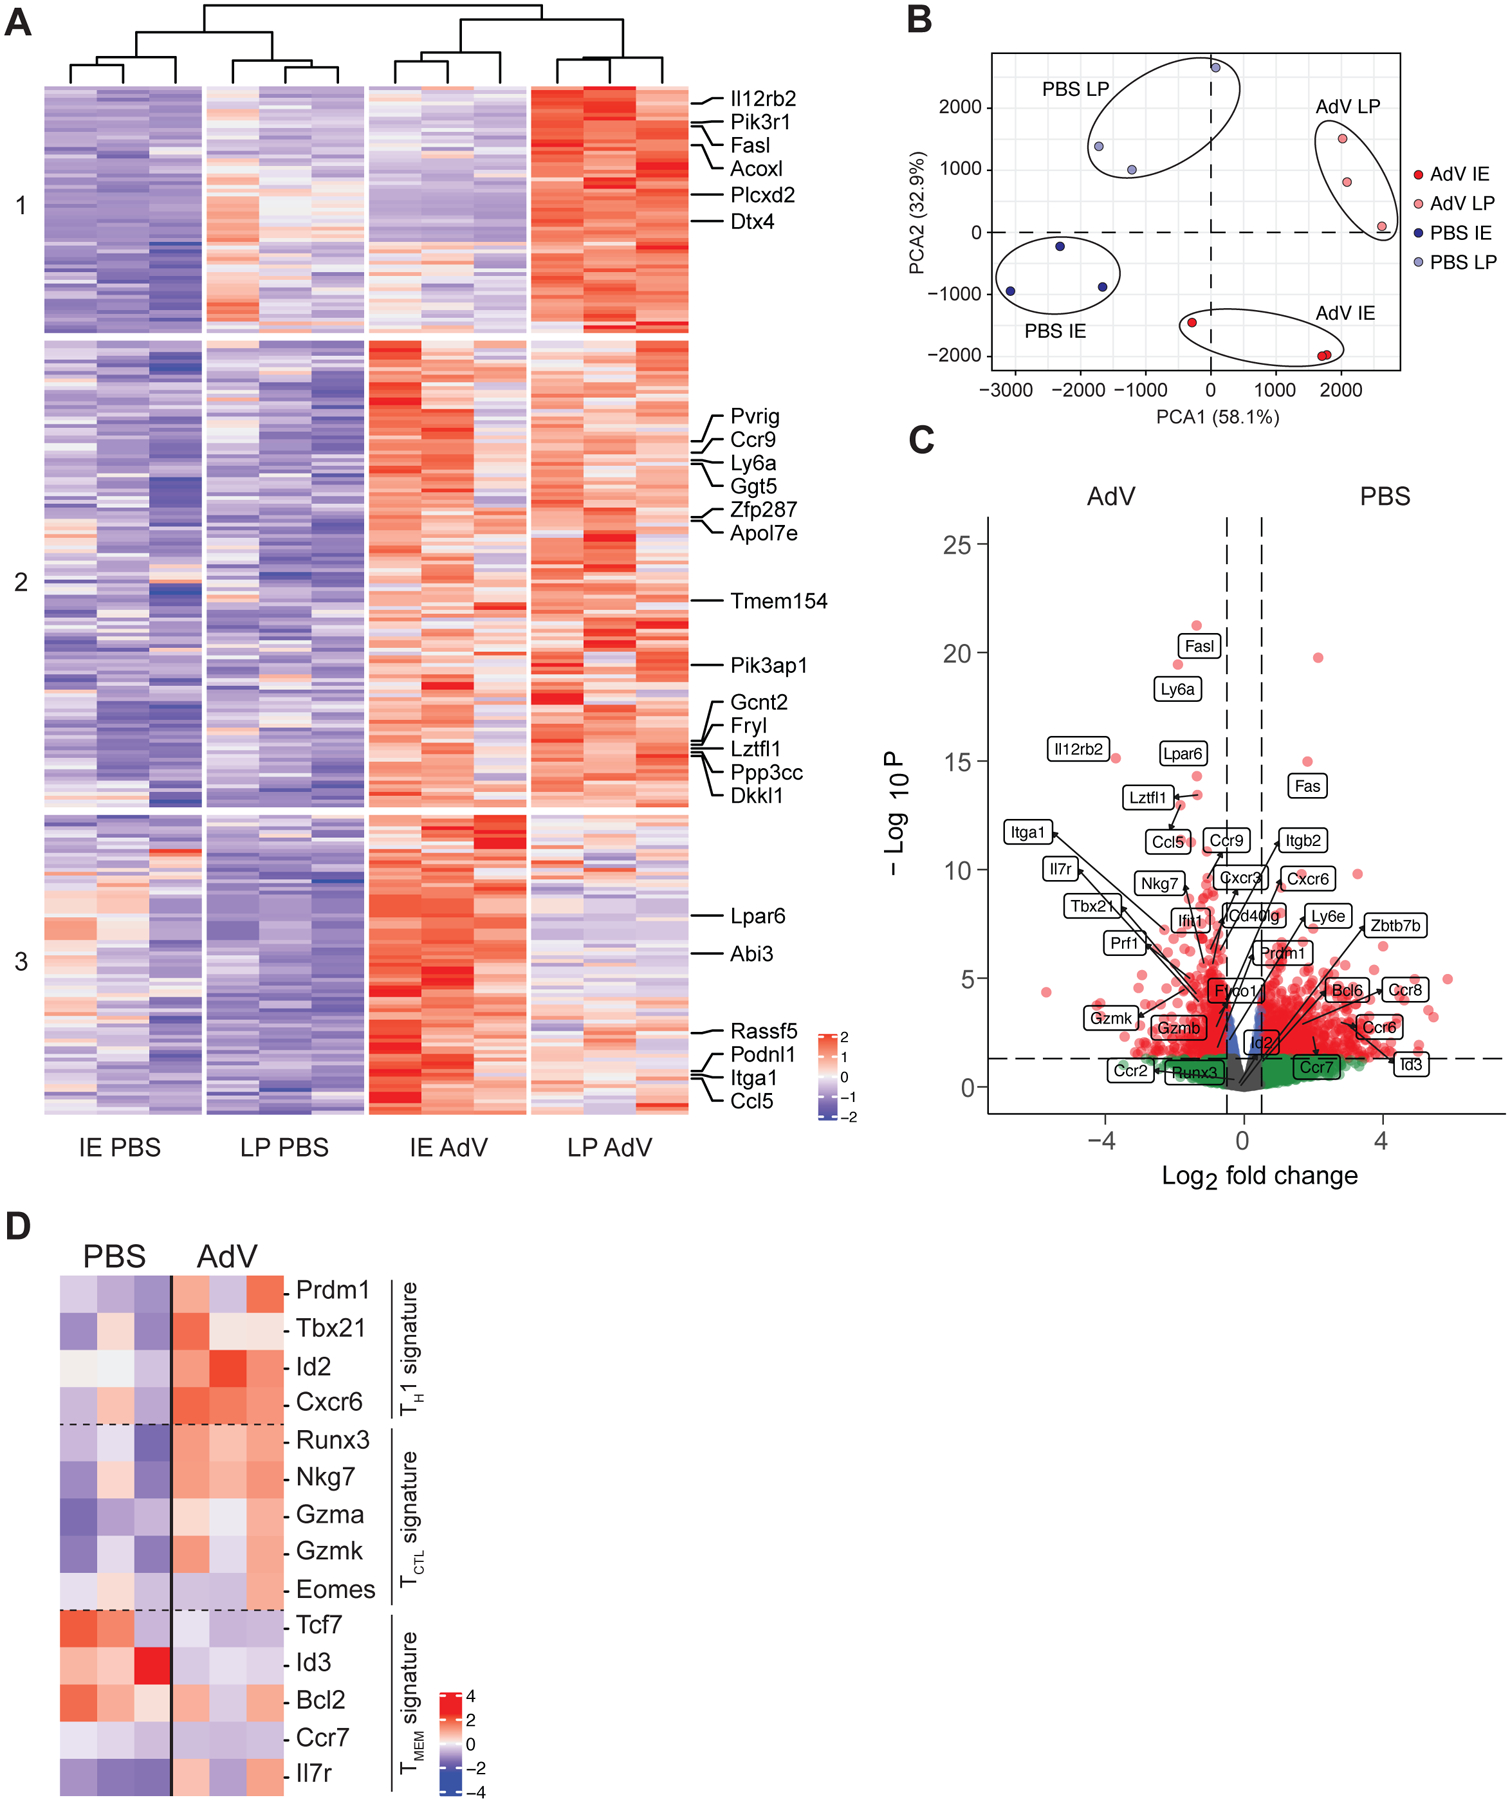
Figure 2. Transcriptional analysis of epithelial-recruited CD4+ T cells post AdV-infection.

iSellTomato mice were infected with AdV or treated with PBS vehicle control, and CD4+CD62L−Tomato+ T cells were sorted from small intestine lamina propria (LP) or intestinal epithelium (IE) 10 days post infection for bulk RNAseq. (A) Heatmap clustering of the most significant differentially expressed genes represented by normalized Z score in LP and IE of AdV-infected and PBS treated control mice. Top 25 genes are annotated. FDR < 0.05. (B) Principal component analysis of sorted T cells in IE and LP compartment of AdV-infected and control mice. (C) Volcano plot visualizing gene fold change (X-axis) versus p value (Y-axis) between T cells from AdV-infected and control mice for both IE and LP combined. Dashed line on y-axis denotes p value of 0.05 and dashed line on x-axis denotes fold change of ± 2. (D) Transcriptional signatures represented by normalized Z score of T cells between AdV-infected and control mice for both IE and LP combined. n = 3 mice per group from one experiment. Data are expressed as means of individual mice.
