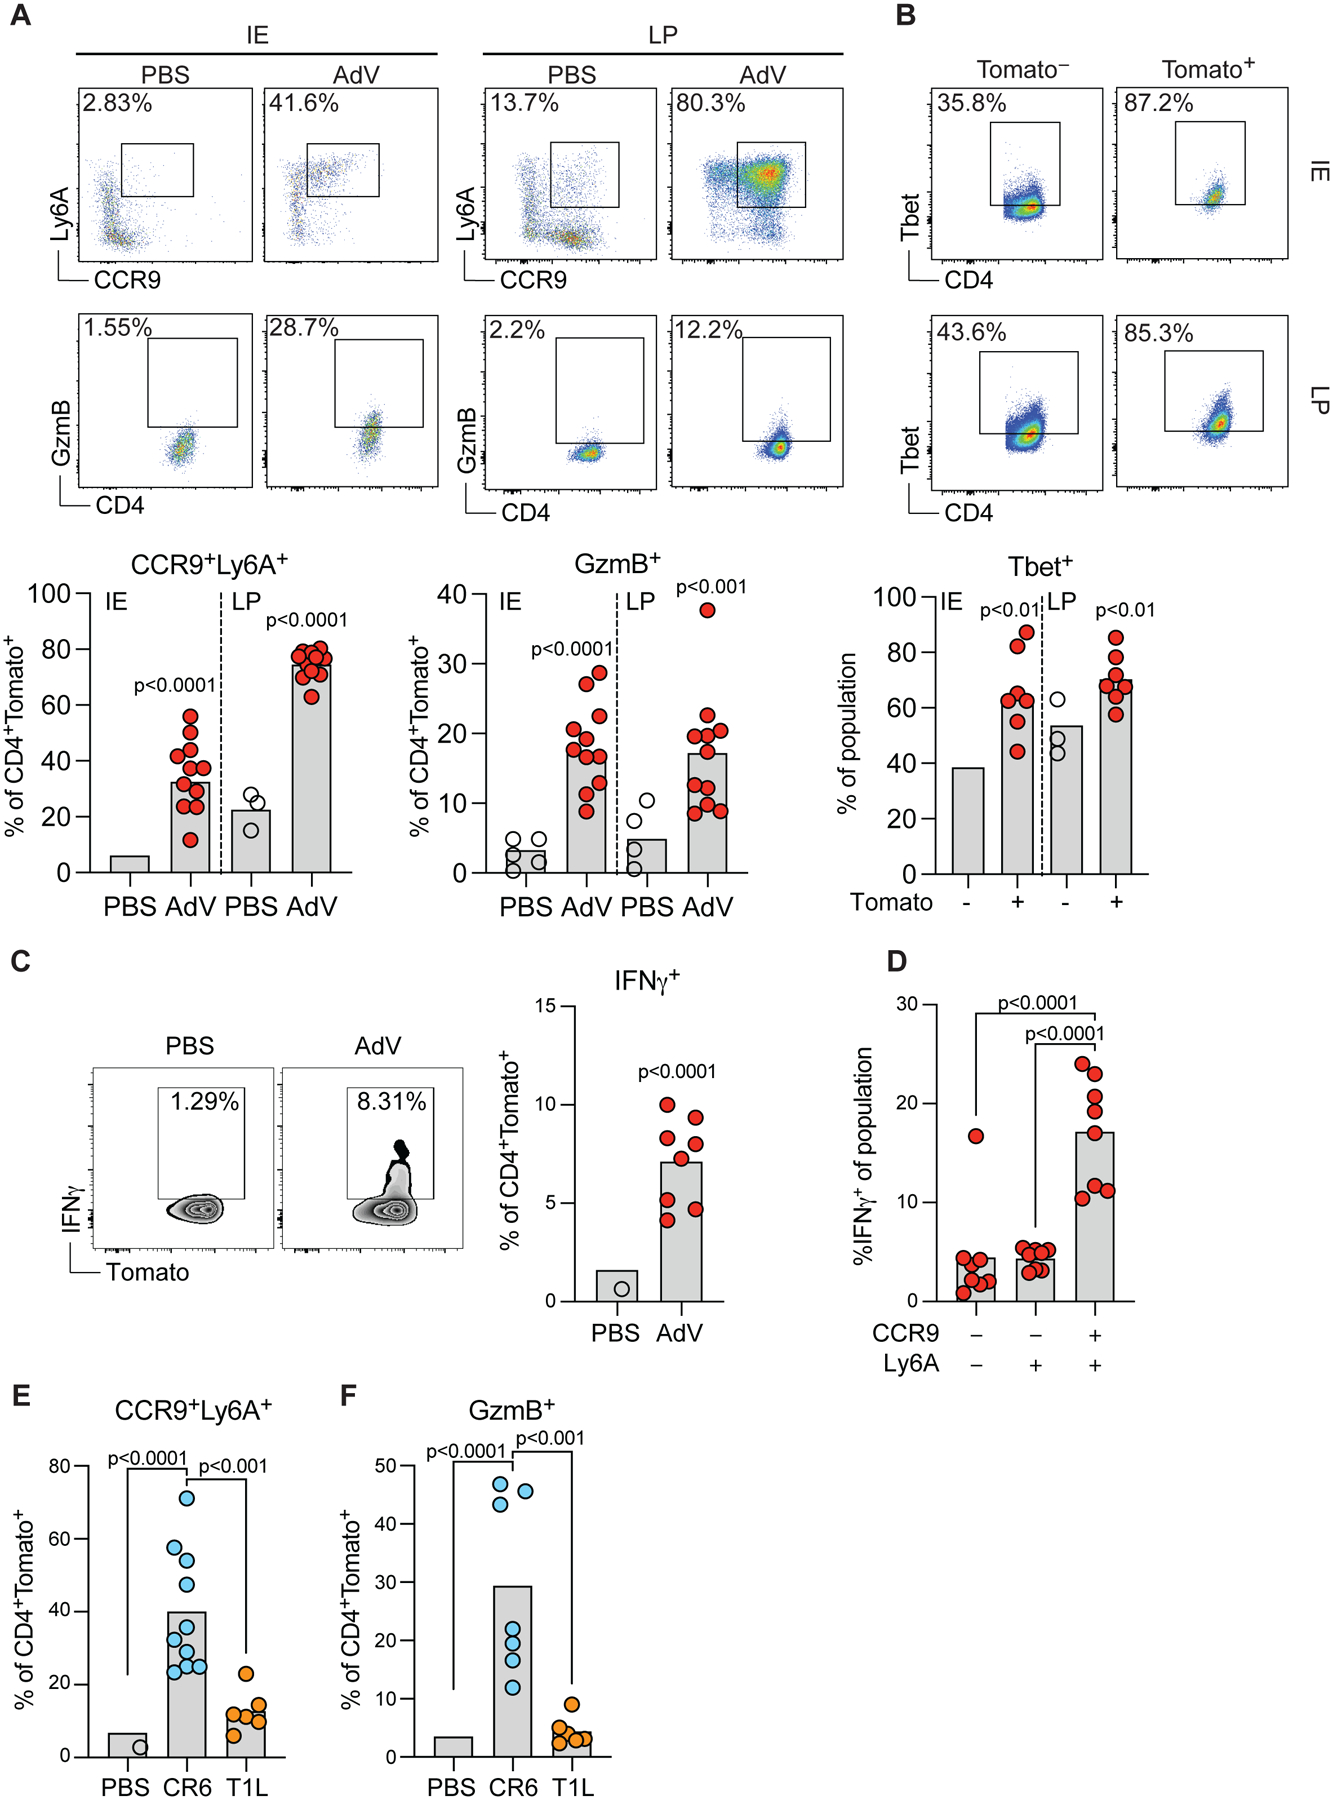
Figure 3. AdV- and CR6-recruited IE CD4+ T cells are enriched for CCR9+Ly6A+ cells and acquire a Th1 and cytotoxic profile.

iSellTomato mice were infected with AdV or treated with PBS vehicle only, and small intestine CD4+CD62L−Tomato+ T cells were analyzed 10 days post infection (A-D). (A) Representative plots (top) of marker expression and population frequencies (bottom) as indicated among CD4+CD62L−Tomato+ T cells in LP or IE compartments. (B) Representative plots (top) and frequencies (bottom) of T-bet expression among Tomato+ or Tomato− cells in IE and LP. (C) Representative plots (left) and frequencies (right) of IFN-γ production among CD4+CD62L−Tomato+ T cells in the IE. (D) Frequencies of IFN-γ production among CCR9−Ly6A−, Ly6A+CCR9− and CCR9+Ly6A+ cells within CD4+Tomato+ T cells. (E-F) iSellTomato mice were infected with CR6 or T1L, or treated with PBS vehicle only, and CD4+CD62L−Tomato+ T cells was analyzed for Ly6A, CCR9 (E) and GzmB (F) expression 10 days post infection among CD4+CD62L−Tomato+ cells. Data are expressed as means of individual mice, for A (n = 10 for control and n = 11 for AdV, of two independent experiments), for B (n = 7 of two independent experiments), for C and D (n = 8 of two independent experiments), for E (n = 6–10, two independent experiments), and for F (n = 6–10, two independent experiments). p values are as indicated, Student’s t-test in A, B and C. One-way ANOVA plus Bonferroni test in D, E and F. See also Figure S2, S3 and S4.
