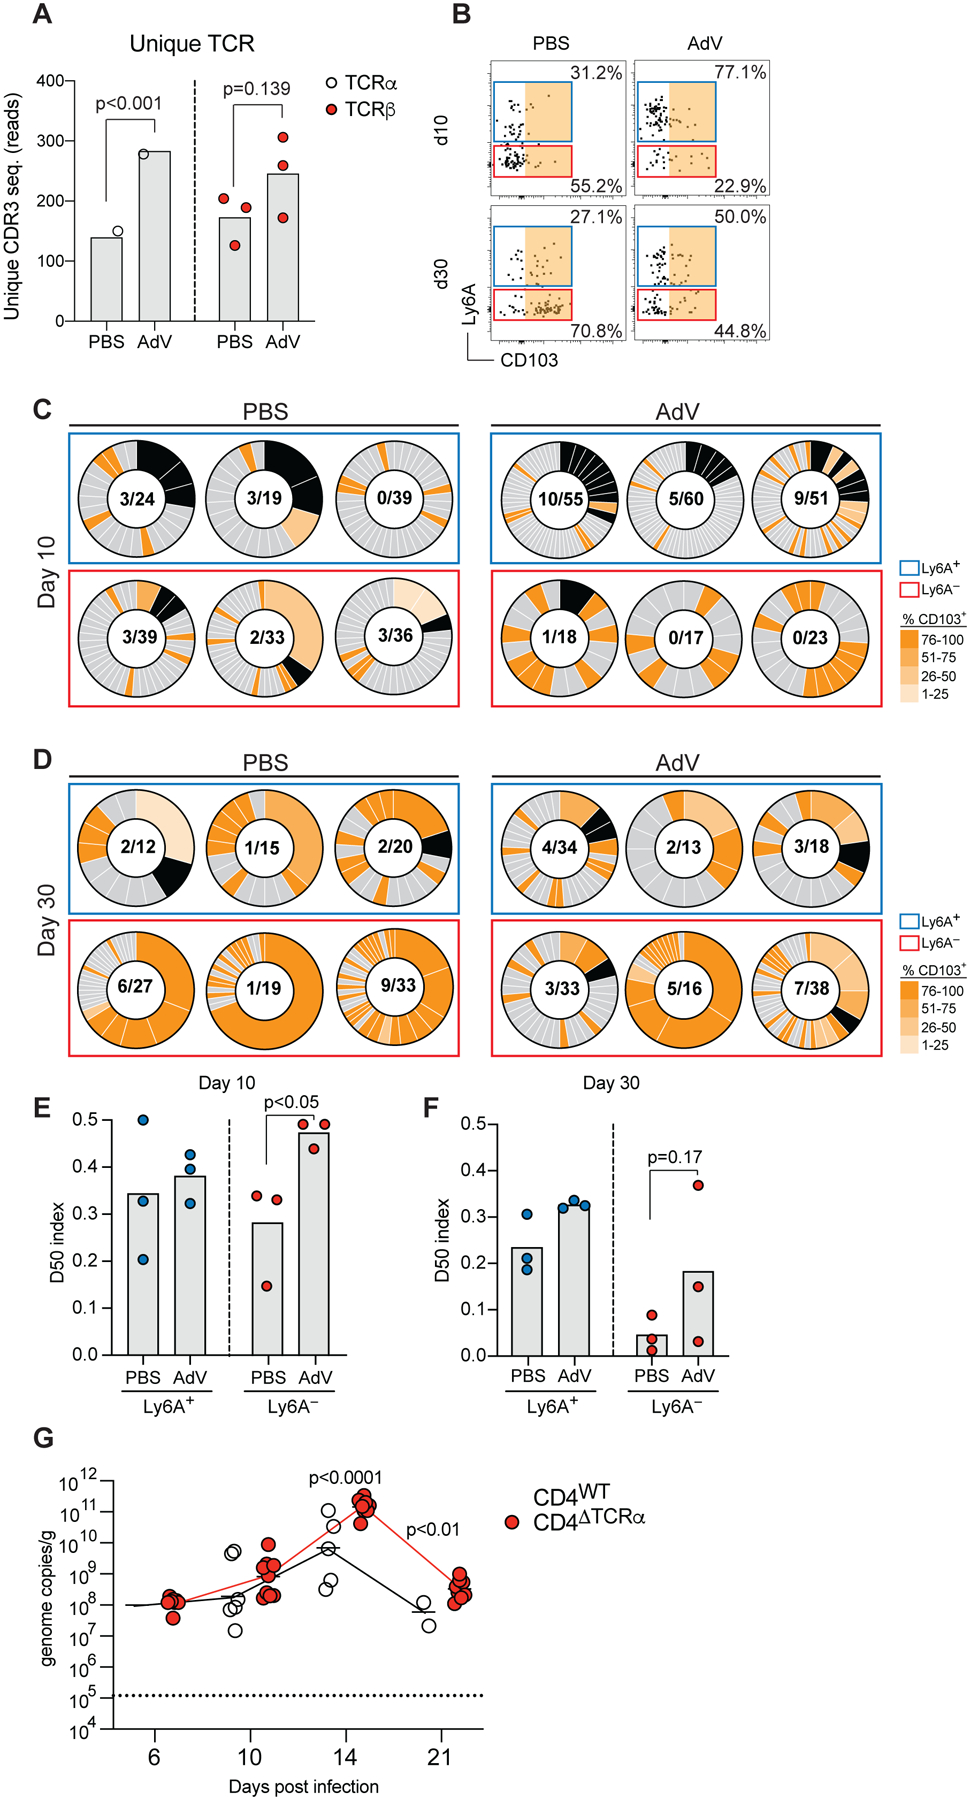
Figure 4. Clonally diverse Ly6A+CD4+ T cells are recruited to the IE compartment 10- and 30-days post AdV-infection.

(A) Unique TCRα and TCRβ CDR3 sequence reads were extracted from bulk RNAseq data in figure 2. (B-F) iSellTomato mice were infected with AdV or treated with PBS vehicle control only, and small intestine CD4+CD62L−Tomato+ T cells were single-cell sorted at 10- and 30-days post infection for TCRβ-seq. (B) Ly6A and CD103 expression analysis of CD4+CD62L+Tomato+ T cells indexed and sorted for analysis in B and C. Colored gates represent indexed analysis in B and C. Orange area indicates CD103+ gate for C and D. Single cell TCRβ analysis at day 10 (C) and day 30 (D) post AdV-infection. Box colors represent gate color in A. Black pie regions represent expanded clones, grade of orange represents level of CD103 expression per clone indexed in A. Nominator represents total number of expanded clones, denominator represent total number of sequenced clones. (E-F) D50 analysis of CD4+Tomato+Ly6A+ and Ly6A− at day 10 (E) and day 30 (F) post AdV infection. (G) Viral genome copies of AdV per gram of feces of AdV-infection over time of iCD4ΔTCRα mice, dashed line represents limit of detection. Data are expressed as mean of individual mice, for A (n = 3 per group and timepoint, 1 experiment), for B-F (n = 3 per group and timepoint, 1 experiment), and for G (n = 8–12, two independent experiments). Significant p values as indicated, Student’s t-test in A, E, F and G. See also Figure S4.
