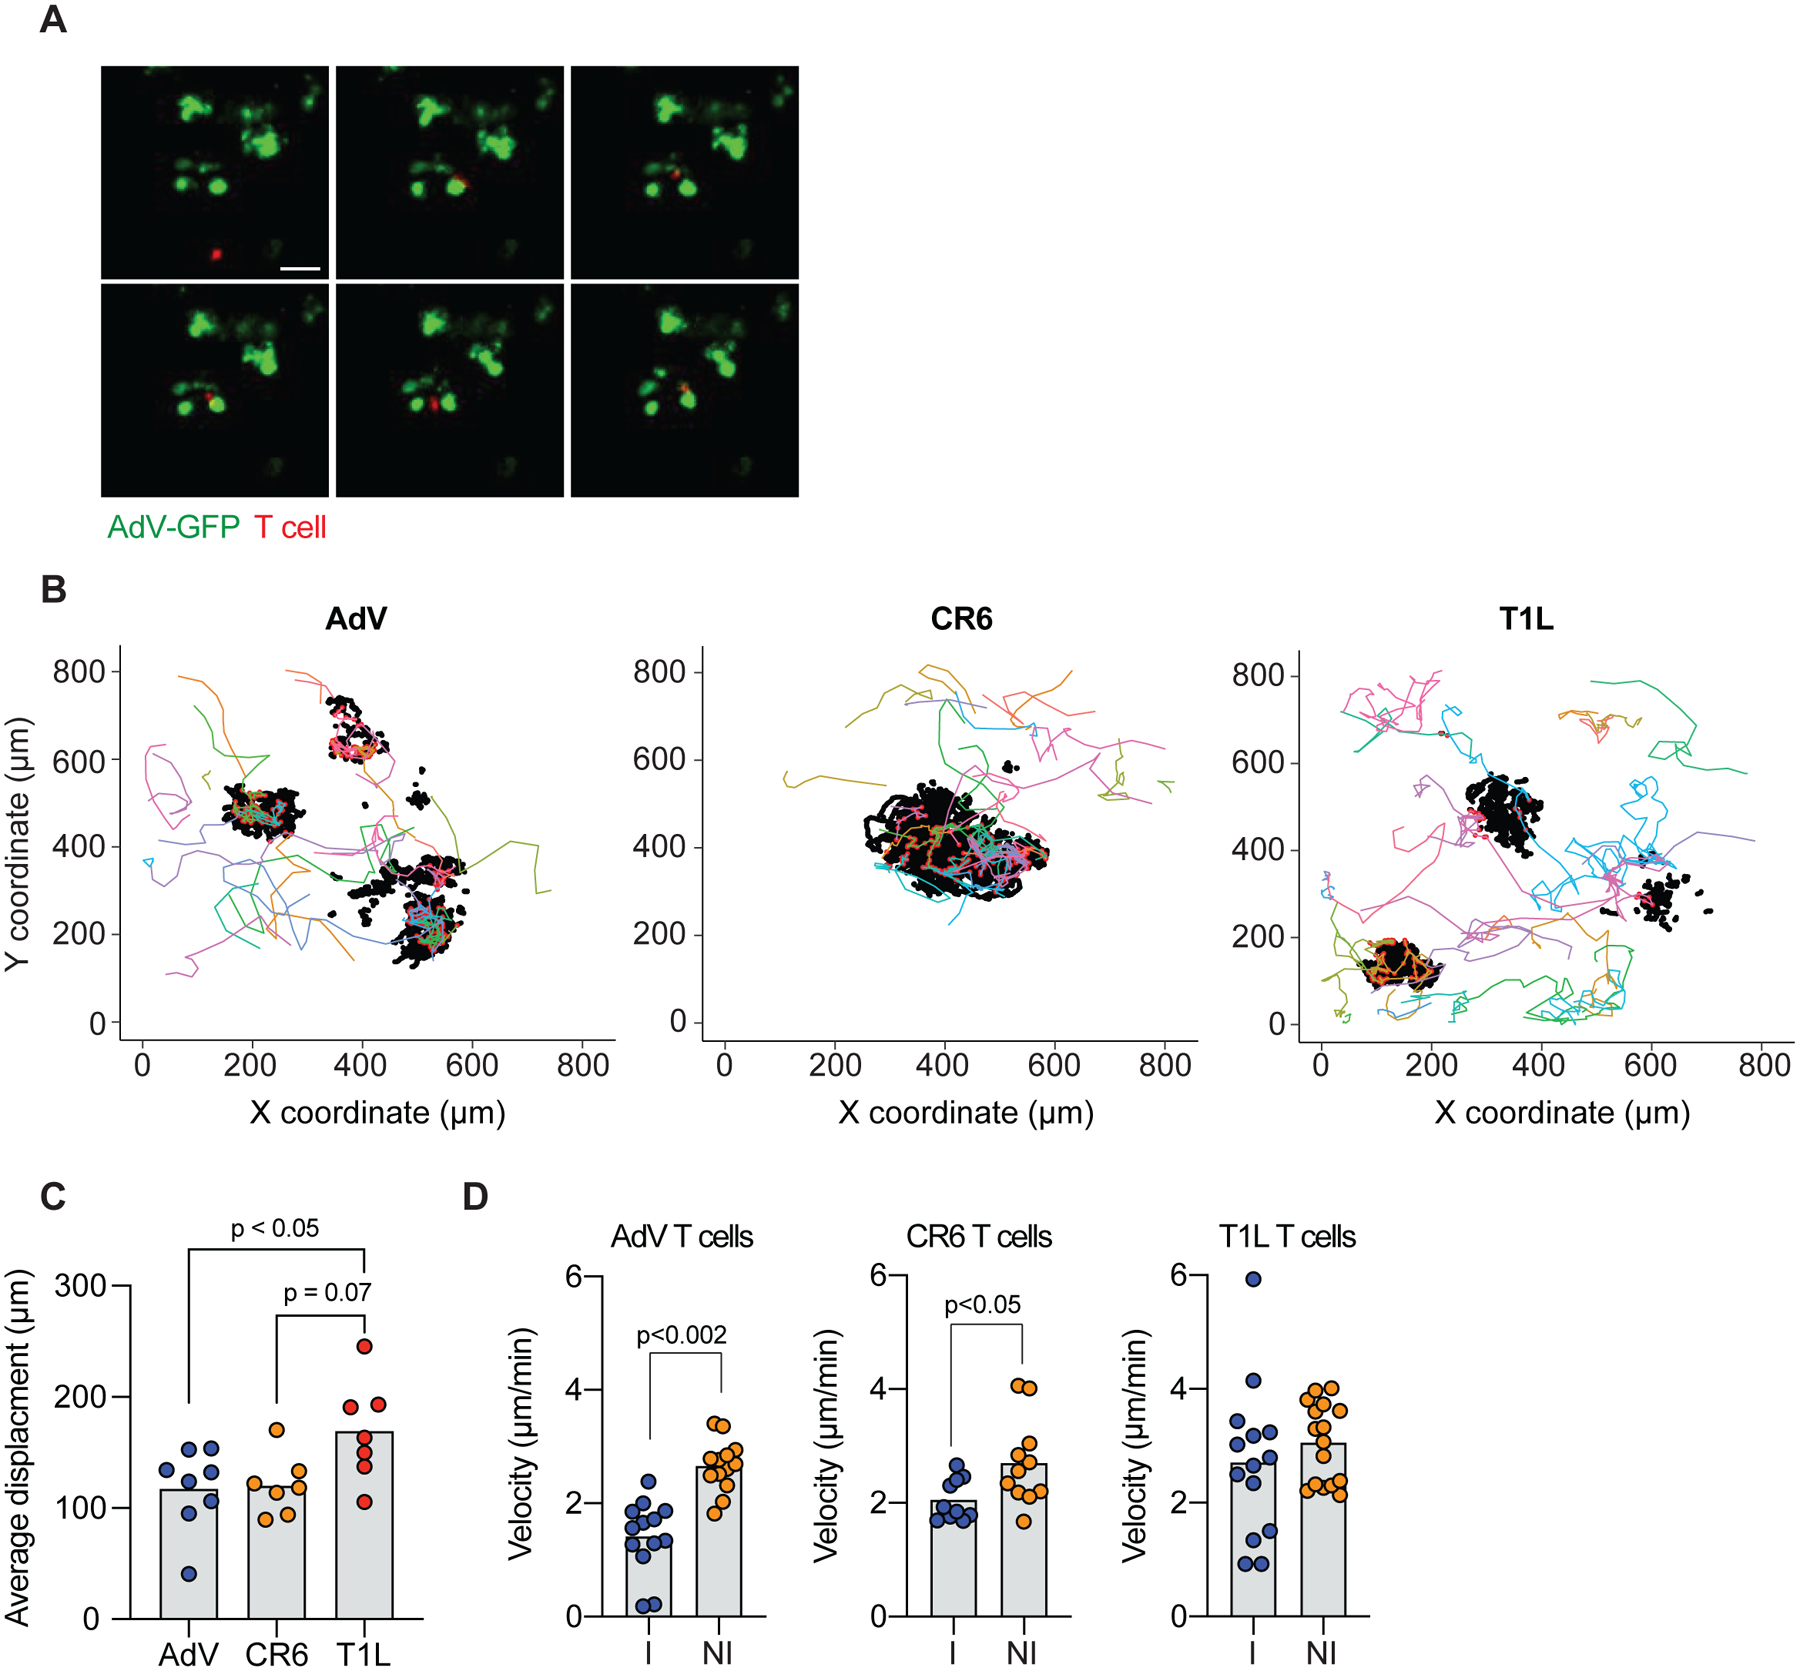
Figure 6. Newly recruited IE CD4+ T cells interact with AdV-infected epithelial cells in intestinal organoids.

(A-D) Small intestine CD4+Tomato+ IE T cells derived from AdV, CR6 or T1L infected iSellTomato mice were co-cultured with AdV-GFP infected organoids and tracked over 48 ± 2 hours. (A) Representative images of AdV-GFP infected organoids (green) and IE CD4+Tomato+ T cells (red) derived from AdV-infected mice. Arrows indicate tracked T cells, top left corner indicates time post infection in minutes. (B) Tracking was obtained in 3 dimensions (x, y, and z); figure shows only x and y. Each colored line represents a unique T cell track, black dots represent GFP+ epithelial cells and red dots represent T cell-organoid interaction points (<20 μm radius distance). (C) Average displacement distance of tracked Tomato+ T cells co-cultured with AdV-infected organoids. (D) Velocity of tracked tomato+ T cells, interacting T cells (I) within 20 μm radius of GFP+ cells, or non-interacting (NI) T cells outside the 20 μm radius of GFP+ cells. Data are expressed as mean of individual organoid in C (n = 7–8, two independent experiments). Data are expressed as average of pooled T cell tracks in D (n = 10–16 of two independent experiments). p values as indicated, One-way ANOVA plus Bonferroni test in C, Student’s t-test in D.
