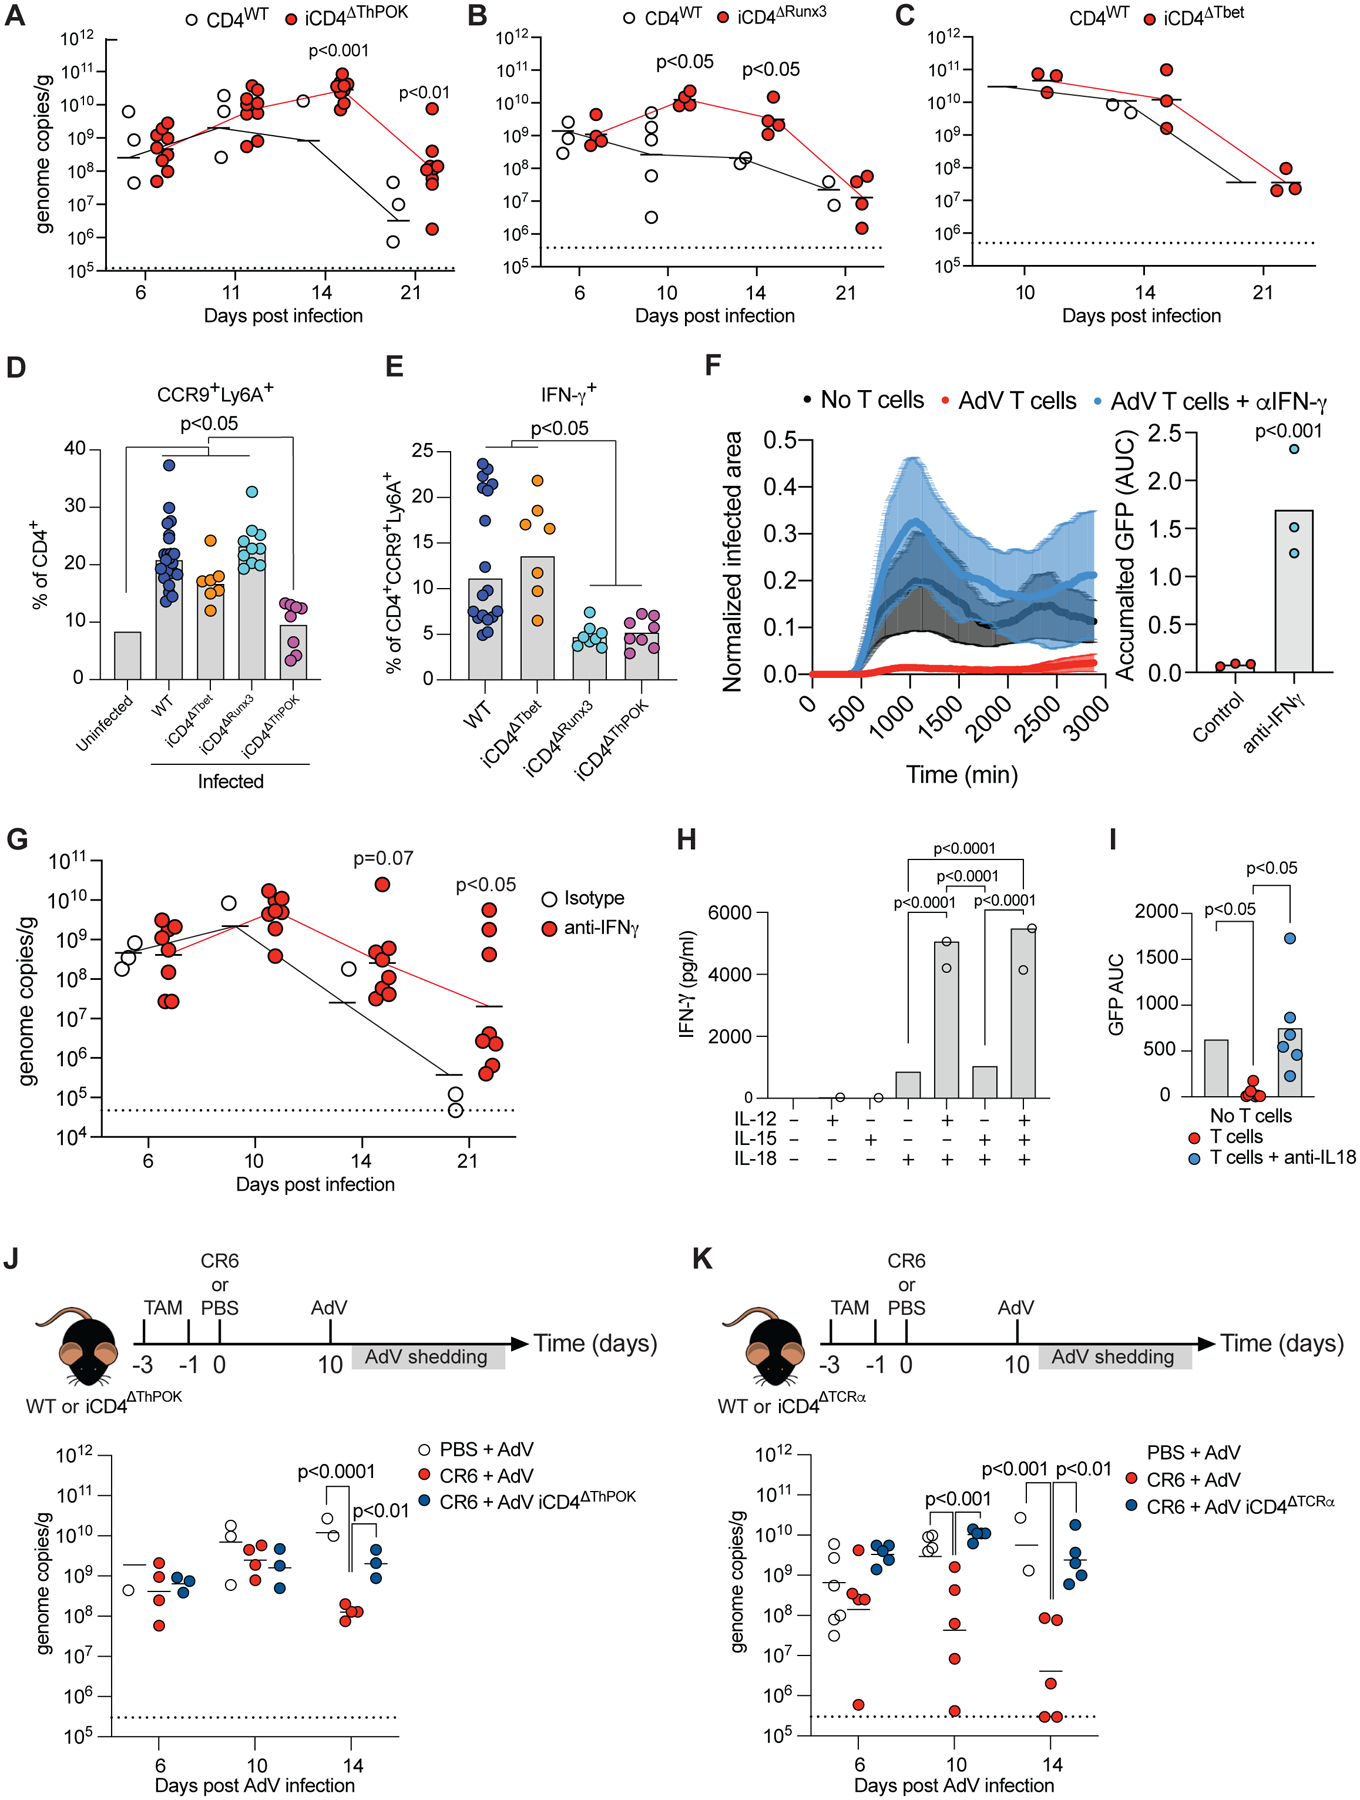
Figure 7. ThPOK-dependent CCR9+Ly6A+ CD4+ T cells show anti-adenoviral function in vivo.

(A-C) AdV genome copies per gram of feces over time of post-infection (A) iCD4ΔThPOK, (B) or iCD4ΔRunx3 (C) iCD4ΔTbet mice. Dashed line represents limit of detection. (D-E) Mice were infected with AdV and small intestine IE T cells were analyzed 10 days post infection. (D) Frequency of CCR9+Ly6A+ cells among CD4+ T cells. (E) IFN-γ production among CCR9+Ly6A+CD4+ T cells. (F, I) iSellTomato mice were infected with AdV and small intestine CD4+Tomato+ T cells were sorted at day 10 post infection. T cells was co-cultured with AdV-GFP infected organoids and imaged with or without anti-IFN-γ (F) or anti-IL-18 (I) blocking antibodies. Normalized infected area over time imaged (left) and accumulated GFP protein expression (right) in indicated conditions. (G) AdV genome copies per gram of feces over time in mice treated with IFN-γ blocking antibody or isotype control at day 8, 10, 12, 14, 16 and 18 post infection. (H) iSellTomato mice were infected with AdV and small intestine CD4+Tomato+ T cells were sorted at day 10 post infection. T cells was cultured and stimulated with IL-12, IL-15 and IL-18 as noted in figure for 24 hours. (J-K) WT, iCD4ΔThPOK or iCD4ΔTCRα mice were infected with CR6 (or PBS as control) and infected with AdV 10 days later. AdV stool shedding was measured post AdV-infection. Dashed line represents limit of detection. AdV genome copies per gram of stool of iCD4ΔThPOK (I) or iCD4ΔTCRα (J) mice relative to WT controls over time. Data are expressed as mean of individual mice in A, B, C, D, E, G, J and K, and F and I is expressed as mean of individual organoids, for A (n = 7–9, two independent experiments), for B (n = 4–5, one experiment), for C (n = 3–5, one experiment), for D and E (n = 7–18, two independent experiments), for G (n = 6–8, two independent experiments), for H (n = 2–3, representative of two independent experiments), for I (n = 6–9, one experiment), for J (n = 3–5, one experiment), for K (n = 5–10, two independent experiments). p values as indicated, one-way ANOVA plus Bonferroni test in D, E, H, I, J (log10 transformed) and K (log10). Student t-test in A (log10), B (log10), C (log10), F and G (log10). See also Figure S5.
