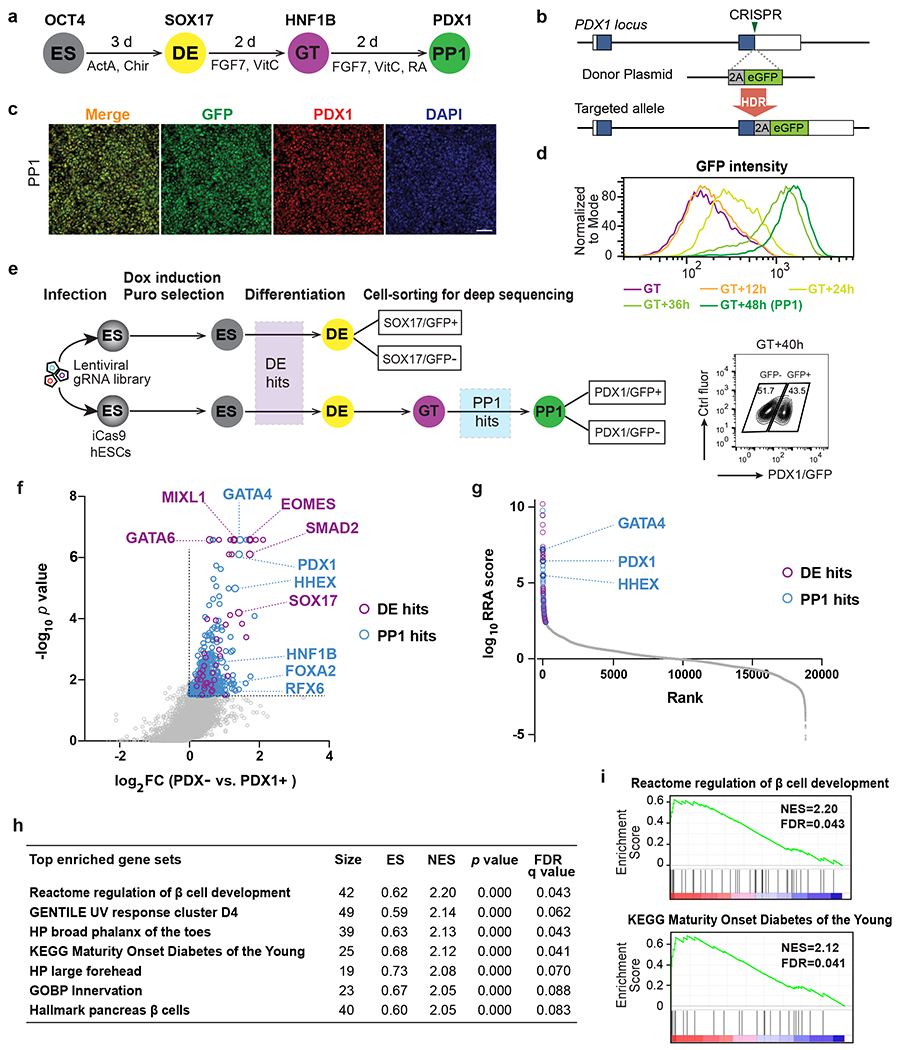
Fig. 1: CRISPR-Cas9 screens identify regulators of pancreatic differentiation.

a, Schematic of stepwise pancreatic differentiation protocol from hESCs. ES, embryonic stem cells; DE, definitive endoderm; GT, gut tube; PP1, early pancreatic progenitors. ActA (Actvin A); VitC (vitamin C); RA (retinoic acid). Lineage-specific markers were indicated.
b, Strategy for generating the PDX1GFP/+ reporter cell line. In the presence of the donor plasmid, HDR results in the replacement of the PDX1 stop codon with 2A-eGFP. Boxes indicate PDX1 exons, and filled blue boxes indicate the coding sequence of PDX1.
c, Immunofluorescence staining shows the co-expression of PDX1 and GFP at PP1 stage. Images shown represent three independent experiments. Scale bar, 50 μm.
d, Histogram plots for live GFP expression from GT to PP1 stage.
e, Schematic of sequential screening approach for regulators in pancreatic differentiation. Upper panel, screen schematic for DE formation using SOX17 GFP/+ reporter iCas9hESCs; Lower panel, screen schematic for pancreas induction using PDX1GFP/+ reporter iCas9hESCs. FACS plot shows the sorted information for PDX1/GFP+ and PDX1/GFP− sub-populations. DOX, doxycycline; puro, puromycin. Ctrl fluor, control fluorescence. Each screen was conducted once with two technical repeats.
f, Scatter plot of −log10 p value versus log2 fold change (FC) for all gRNA targeted genes in the PP1 screen. Each circle represents an individual gene. −log10 p >1.5 and log2 FC > 0 were used to identify PP1 hits (in blue), except that the purple circles indicate genes also identified as DE hits (p < 0.01 and log2 FC > 0 based on DE screening results). Selected DE and PP1 positive regulator hits are indicated.
g, Each gene target in the screen ranked based on the MAGeCK robust ranking aggregation (RRA) score at the PP1 stage. Y axis represents log10 (PP1 positive score) – log10 (PP1 negative score). The top 200 genes are labeled with blue (PP1 specific) and purple circles (also identified as DE hits), respectively. Selected top PP1 hits are indicated.
h, GSEA analysis showing the top gene sets that are associated with PP1 screening results. ES, enrichment score; NES, normalized enrichment score.
i, GSEA enrichment plots of selected gene sets.
