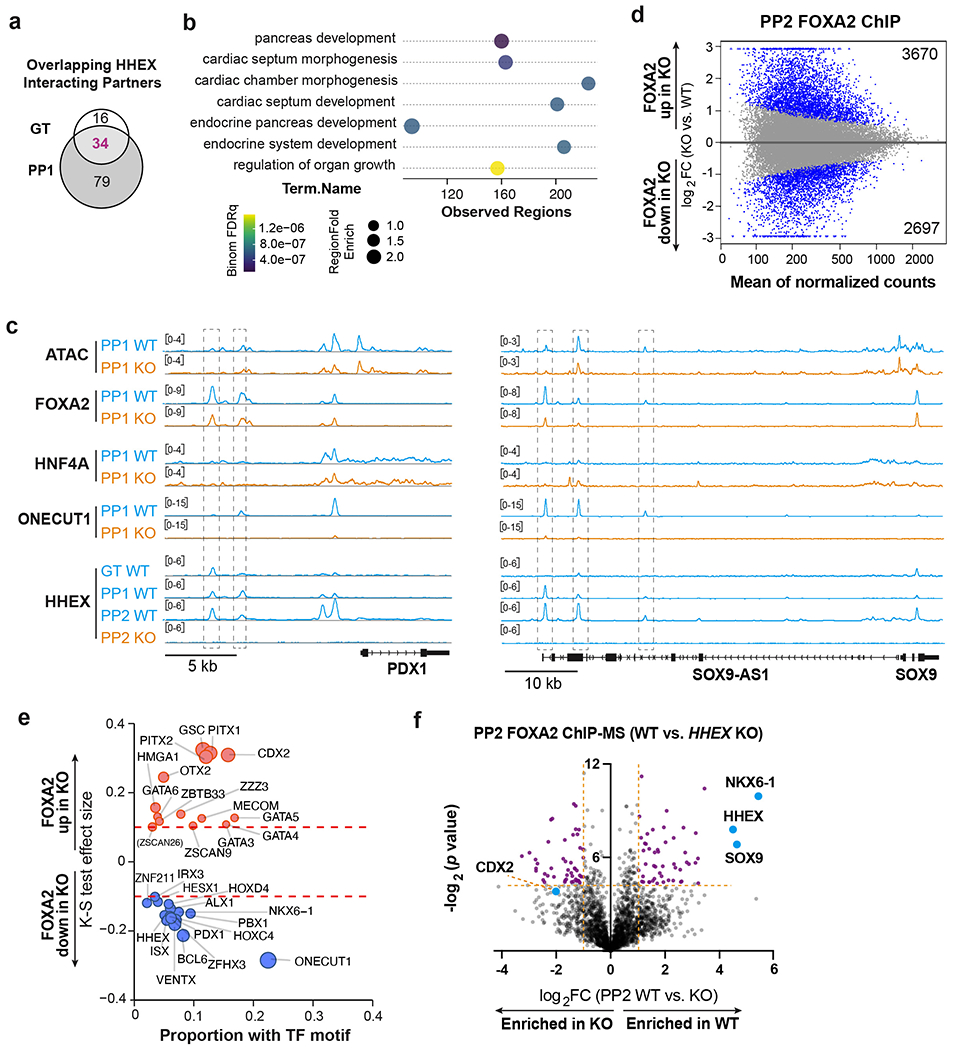
Extended Data Fig. 5: HHEX and FOXA2 ChIP-MS and ChIP-seq analysis.

a, Venn diagram of significantly enriched proteins at the GT and PP1 stages for HHEX ChIP-MS.
b, GREAT Gene Ontology showing the top 7 biological process associated with the FOXA2-down regions. The term of mouse phenotypes was selected based on the binom rank and cutoffs of region fold enrich >1.5 and observed regions>80.
c, IGV tracks (average of two independent experiments) to show chromatin accessibility and TFs binding activities at the PDX1 (left panel) and SOX9 (right panel) loci in WT and KO cells. Tracks are generated from two independent experiments. Scale bars was indicated. The regions showed significant decreasing of FOXA2 binding upon HHEX deletion were indicated.
d, MA plot of significantly increased and decreased FOXA2 binding sites (blue color) at the PP2 stage upon HHEX deletion. The number of significantly increased and decreased FOXA2 binding sites is indicated.
e, TF motifs enriched in the differential FOXA2 binding regions upon HHEX deletion. Significantly increased/decreased FOXA2 binding peaks were compared with the total atlas to examine the TF motif enrichments using the one-sided KS test. The KS test effect size is shown on the y axis, and the proportion of peaks associated with the TF motif is plotted on the x axis. The size of each circle represents the odds ratio, which was defined as the frequency of the TF in an opened or closed group divided by its frequency in the entire atlas. TF motifs with a KS test effect size ≥ 0.1 (indicated by the dashed lines) and odds ratio ≥ 1.2 are shown.
f, Volcano plots of significantly enriched proteins (purple labeled) for FOXA2 ChIP-MS at the PP2 stage WT or KO cells. Dotted lines indicate the fold change and significance cutoffs. CDX2 (log2 FC = −2.01, p = 0.067) is also indicated. Data shown in a-e are from two independent experiments, and data shown in f represent three independent experiments.
