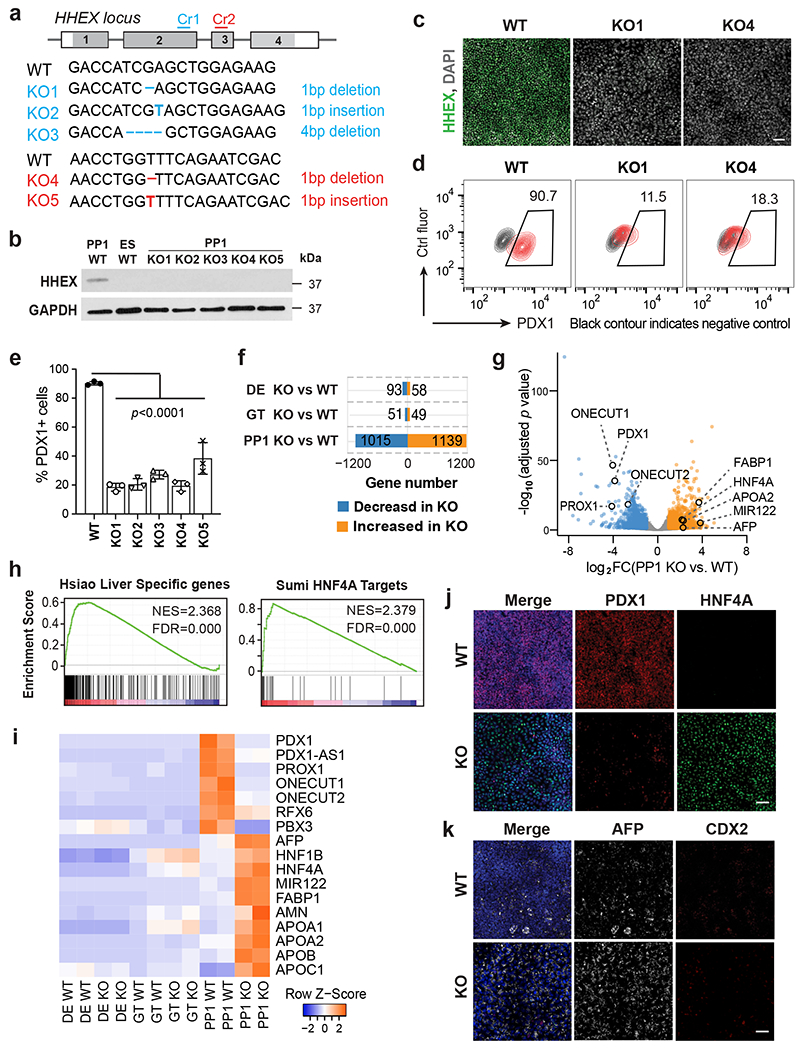
Fig. 3: Deletion of HHEX impairs human pancreatic differentiation.

a, Schematic illustrating HHEX targeting. CRISPR gRNA 1 and gRNA 2 (Cr1, Cr2) were designed and targeted at HHEX exon 2 and exon 3, respectively. The consequential homozygous mutations are summarized. Boxes indicate HHEX exons, and filled gray boxes indicate the coding sequence of HHEX.
b,c, The loss of HHEX protein was verified by western blot (b) at the PP1 stage and immunofluorescence staining (c) at the DE stage. GAPDH was used as a loading control. Scale bar, 50 μm.
d,e, Flow cytometry analysis (d) and quantification (e) for PDX1 expression at the PP1 stage. Each symbol represents one independent experiment (n = 3 independent experiments) and data are presented as mean ± SD. One-way ANOVA followed by Dunnett multiple comparisons test vs. WT control.
f,g, Bar graph (f) and volcano plot (g) showing differentially expressed genes identified in KO cells vs. WT during pancreatic differentiation. Genes with log2 FC >1 and FDR <0 .05 are counted as one significant hit. Significantly up-regulated and down-regulated genes in the PP1 KO cells were labeled by orange and blue color, respectively.
h, GSEA shows the enrichment of liver genes and HNF4A targets in PP1 KO cells vs. WT.
i, Heatmap showing the expression of pancreatic and liver genes in WT and KO cells during pancreatic differentiation.
j,k, Immunofluorescence staining of PDX1 and HNF4A (i), AFP and CDX2 (j) at the PP1 stage WT and KO cells. Scale bar, 50 μm. Images shown in b,c, j and k represent three independent experiments, and RNA-seq data shown in f-i are from two independent experiments.
