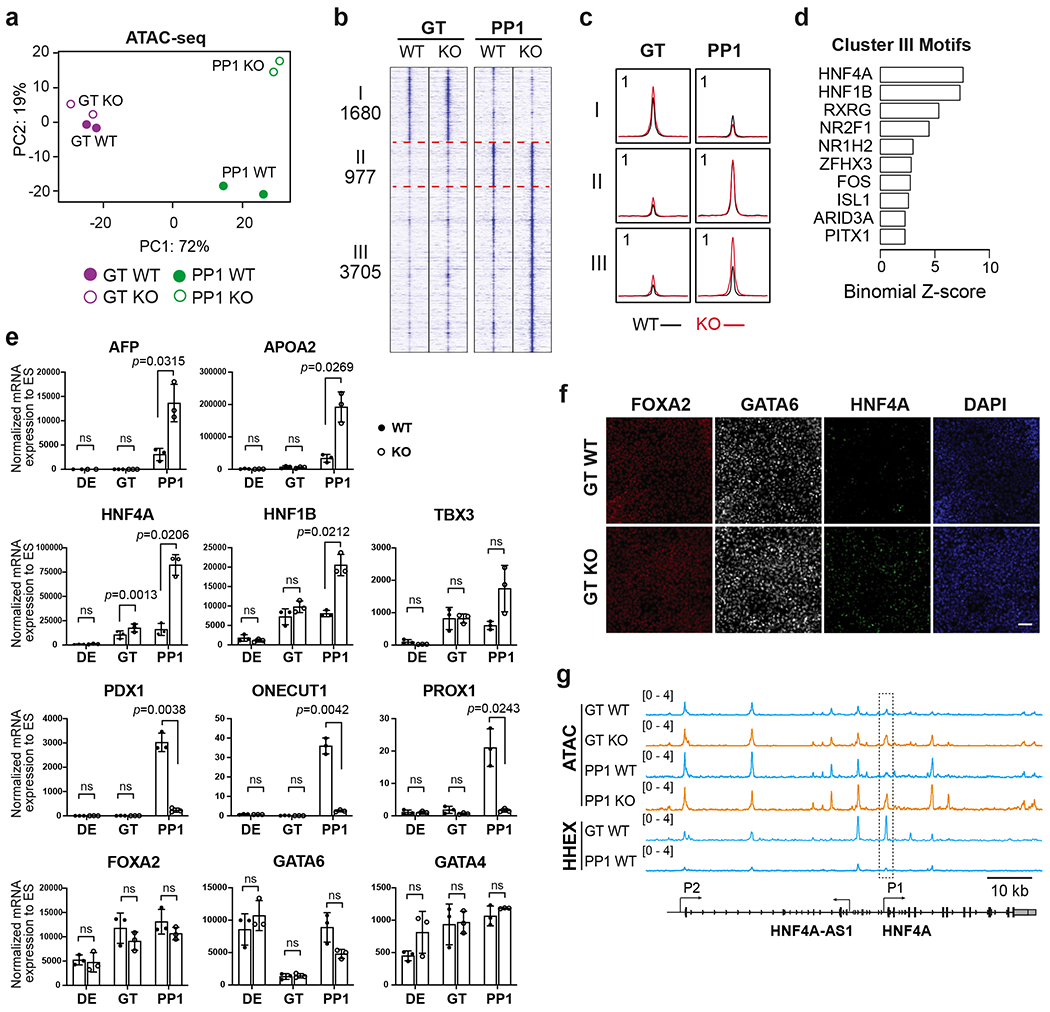
Fig. 4: HHEX deletion results in early induction of a liver-like transcriptional program.

a, PCA of top 3000 most variable genes in WT and HHEX KO cells at the GT and PP1 stages.
b,c, Visualization of ATAC-seq profile at the GT and PP1 stages, patterned by hierarchical clustering of signal tracks (average of two independent experiments) around ATAC-seq peak summits ± 3 kb. (b), tornado plots. (c), metapeaks defined from the column average of the signal. The maximum value of each y axis is annotated in tags per million (TPM).
d, Enrichment of top 10 TF motifs in the regulatory regions III. One-sided hypergeometric test was used to compare the enrichment of proportions of TF motifs for each cluster (foreground ratio) versus those for total atlas (background ratio). The horizontal axis shows the binomial Z-score, representing the number of standard deviations between the observed count of each cluster peaks containing a TF motif and the expected count based on the background ratio. The p values are provided in the Supplementary Table 3.
e, The expression levels of pancreatic and liver genes in WT and KO cells were measured at the DE, GT, and PP1 stages. Each symbol represents one independent experiment (n = 3 independent experiments) and data are presented as mean ± SD. Statistical analysis was performed by paired two-tailed Student’s t-test KO vs. WT control. ns, not significant (p ≥ 0.05).
f, Immunofluorescence staining of FOXA2, GATA6 and HNF4A at the GT stage WT and KO cells. Scale bar, 50 μm. Images shown represent three independent experiments.
g, Integrative Genomics Viewer (IGV) tracks (average of two independent experiments) to show chromatin accessibility and HHEX binding activities at the HNF4A locus. The P1 promoter region of HNF4A showing significantly increased chromatin accessibility upon HHEX deletion was indicated. Scale bar, 10 kb. Data shown in a-d and g are from two independent experiments.
