
Fig. 5: HHEX KO cells acquire duodenum-like cell state upon inhibition of liver differentiation.
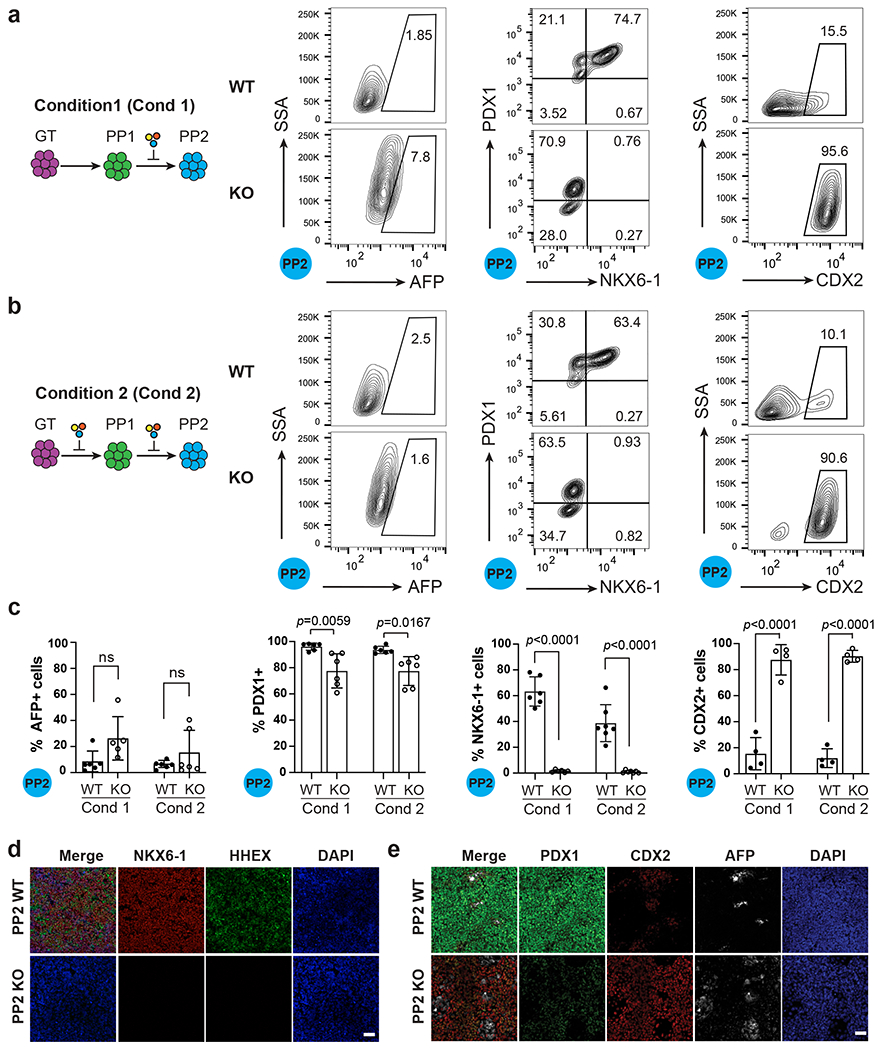
a, Schematic showing the strategy of differentiation using Condition 1 (Cond 1) and flow cytometry analysis for AFP, PDX1, NKX6.1 and CDX2 expression under Condition 1 at the PP2 stage. Additional chemical cocktail was induced after the PP1 stage, a stage displaying ectopic liver genes expression in HHEX KO cells.
b, Schematic showing the strategy of differentiation using Condition 2 (Cond 2) and flow cytometry analysis for AFP, PDX1, NKX6.1 and CDX2 expression under Condition 2 at the PP2 stage. Additional chemical cocktail was induced during both the PP1 and PP2 stage.
c, Quantification of flow cytometry analysis of AFP+, PDX1+, NKX6-1+, and CDX2+ cells at the PP2 stage in both conditions. Each symbol represents one independent experiment (n = 6 independent experiments, except for CDX2 staining, where n = 4 independent experiments) and data are presented as mean ± SD. Statistical analysis was performed using two-way ANOVA followed by multiple comparisons with Tukey correction.
d, Immunostaining images for HHEX, PDX1 and NKX6-1 expression at the PP2 stage WT/KO cells using differentiation Condition 1. Scale bar, 50 μm.
e, Immunostaining images for PDX1, CDX2, AFP expression at the PP2 stage WT/KO cells using differentiation Condition 1. Images shown in d and e represent three independent experiments. Scale bar, 50 μm.