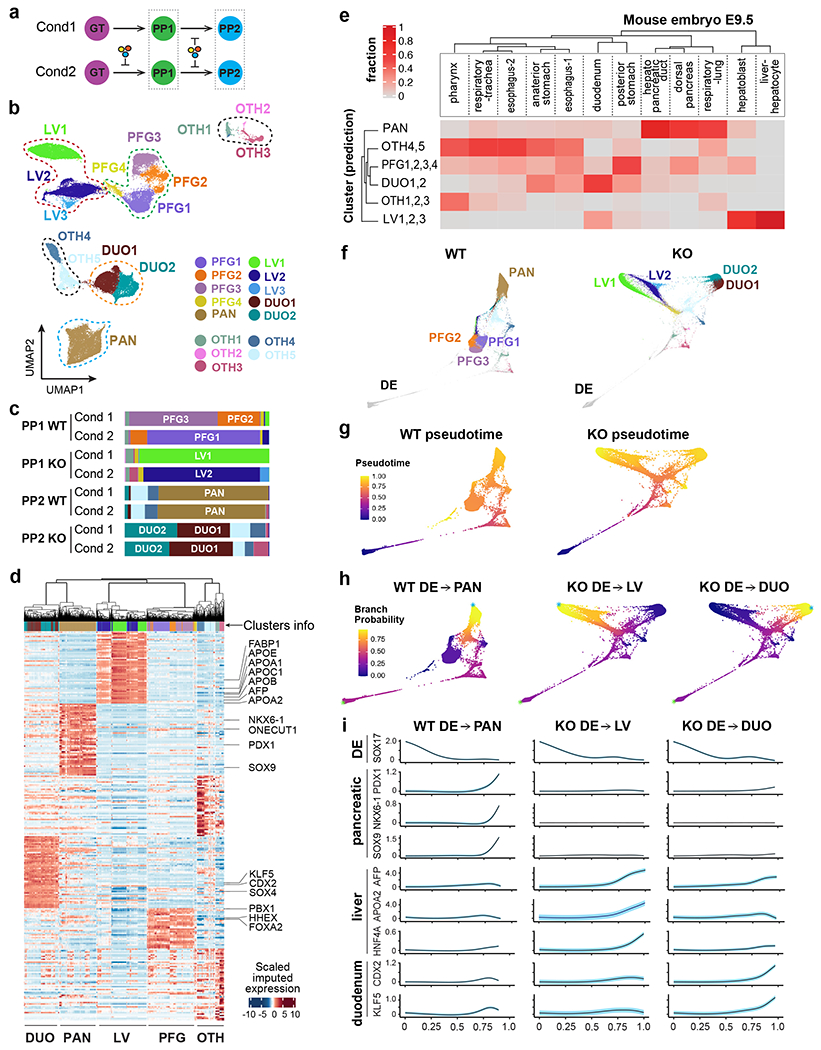
Fig. 6: scRNA-seq reveals differentiation trajectories of WT and HHEX KO cells.

a, Schematic of single cell transcriptome profiling of WT and KO cells at PP1/PP2 stages from two differentiation conditions (one biological replicate per condition).
b, UMAP visualization of the main PP1/PP2 populations. Seurat clusters 1-15, shown with distinct colors, were annotated and grouped based on known markers.
c, Bar plots illustrating the composition of each sample across the clusters in (b). The stacks show fractions per sample.
d, Heatmap reporting MAGIC-imputed expression values (standardized per gene) of the top 50 differentially expressed genes for each group, as annotated in (b). Significant genes (FC > 1.5 and adjusted p < 0.05) were selected by comparing each group to the rest using MAST.
e, Heatmap reporting the fraction of E9.5 mouse endoderm-derived populations49 mapping to in vitro-derived human populations from (b). The sum of values in each column equals 1.
f, WT and KO lineages visualized by forced-directed layouts of the integrated data from the DE, GT, PP1, and PP2 stages. PP1/PP2 populations were annotated as in (b).
g, h, The pseudotime ordering (g) and branch probabilities (h) of selected WT or KO differentiation trajectories. A DE cell was selected as the start of each trajectory (indicated by green asterisks), and the terminal points (indicated by blue asterisks) were identified by Palantir.
i, The trends of gene expression along the pseudotime of trajectories in (g,h). The highlights show ± standard error.
