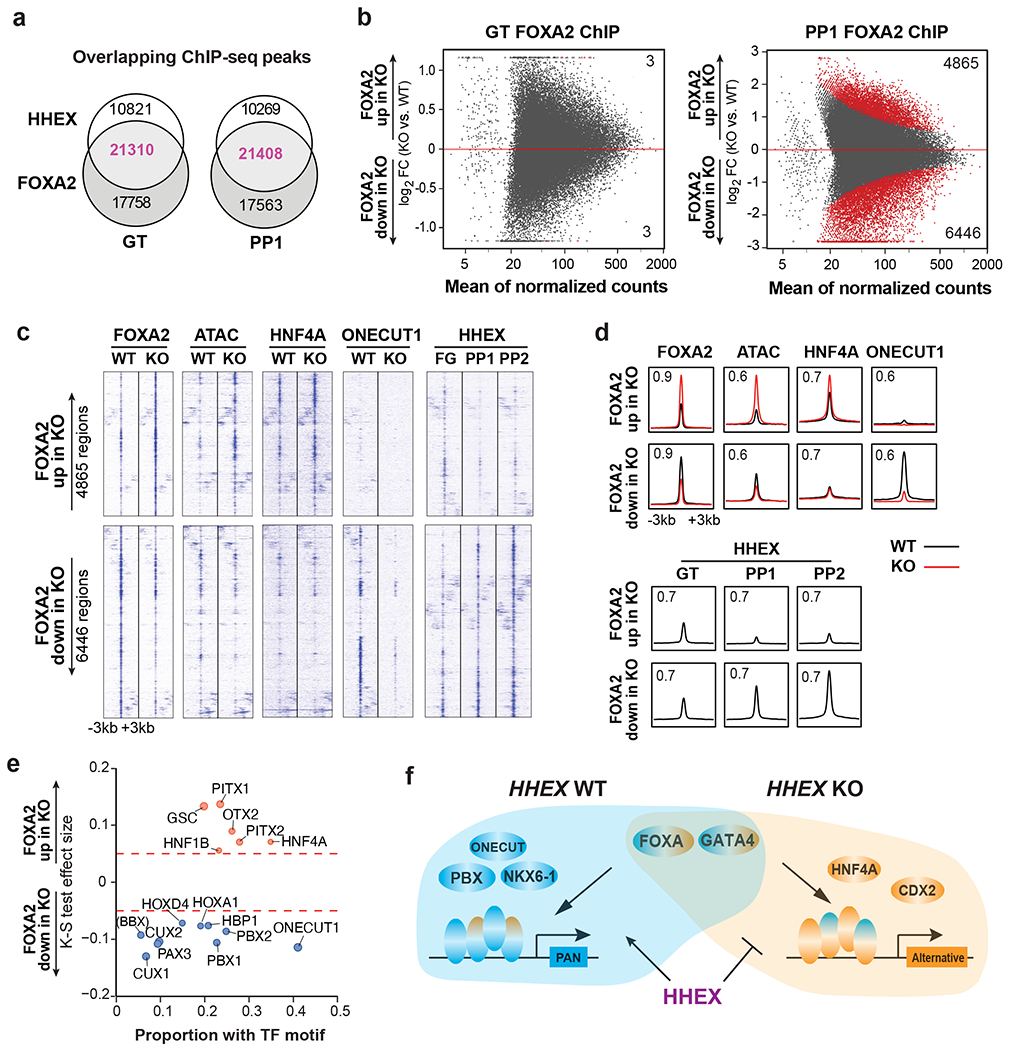
Fig. 8: HHEX protects FOXA2 binding to pancreatic regulatory regions.

a, Venn diagram representing the number of co-bound regions identified in HHEX and FOXA2 ChIP-seq at the GT and PP1 stage WT cells.
b, MA plot of significantly increased and decreased FOXA2 binding sites (red color) at the GT and PP1 stages upon HHEX deletion. The number of significantly increased and decreased FOXA2 binding sites is indicated.
c,d, Genomic visualization of loci associated with the significantly increased and decreased activity of FOXA2 binding in KO cells versus WT. ChIP-seq of FOXA2, HNF4A, and ONECUT1 at the PP1 stage were shown, and ATAC-seq was visualized at the same regions. HHEX ChIP-seq was shown for GT, PP1, and PP2 WT. (c), tornado plots. (d), metapeaks, from the column average of the signal. The maximum value of each y axis is annotated in TPM. Plots represent the average of two independent experiments.
e, TF motifs enriched in the differential FOXA2 binding regions upon HHEX deletion. Significantly increased/decreased FOXA2 binding peaks were compared with the total atlas to examine the TF motif enrichments using the one-sided Kolmogorov-Smirnov (KS) test. The KS test effect size is shown on the y axis, and the proportion of peaks associated with the TF motif is plotted on the x axis. The size of each circle represents the odds ratio, which was defined as the frequency of the TF in an opened or closed group divided by its frequency in the entire atlas. TF motifs with a KS test effect size ≥ 0.05 (indicated by the dashed lines) and odds ratio ≥ 1.2 are shown.
f, Schematic illustrating HHEX interaction with FOXA2 and other TFs in pancreatic differentiation conditions. Data shown in a-e are from two independent experiments.
