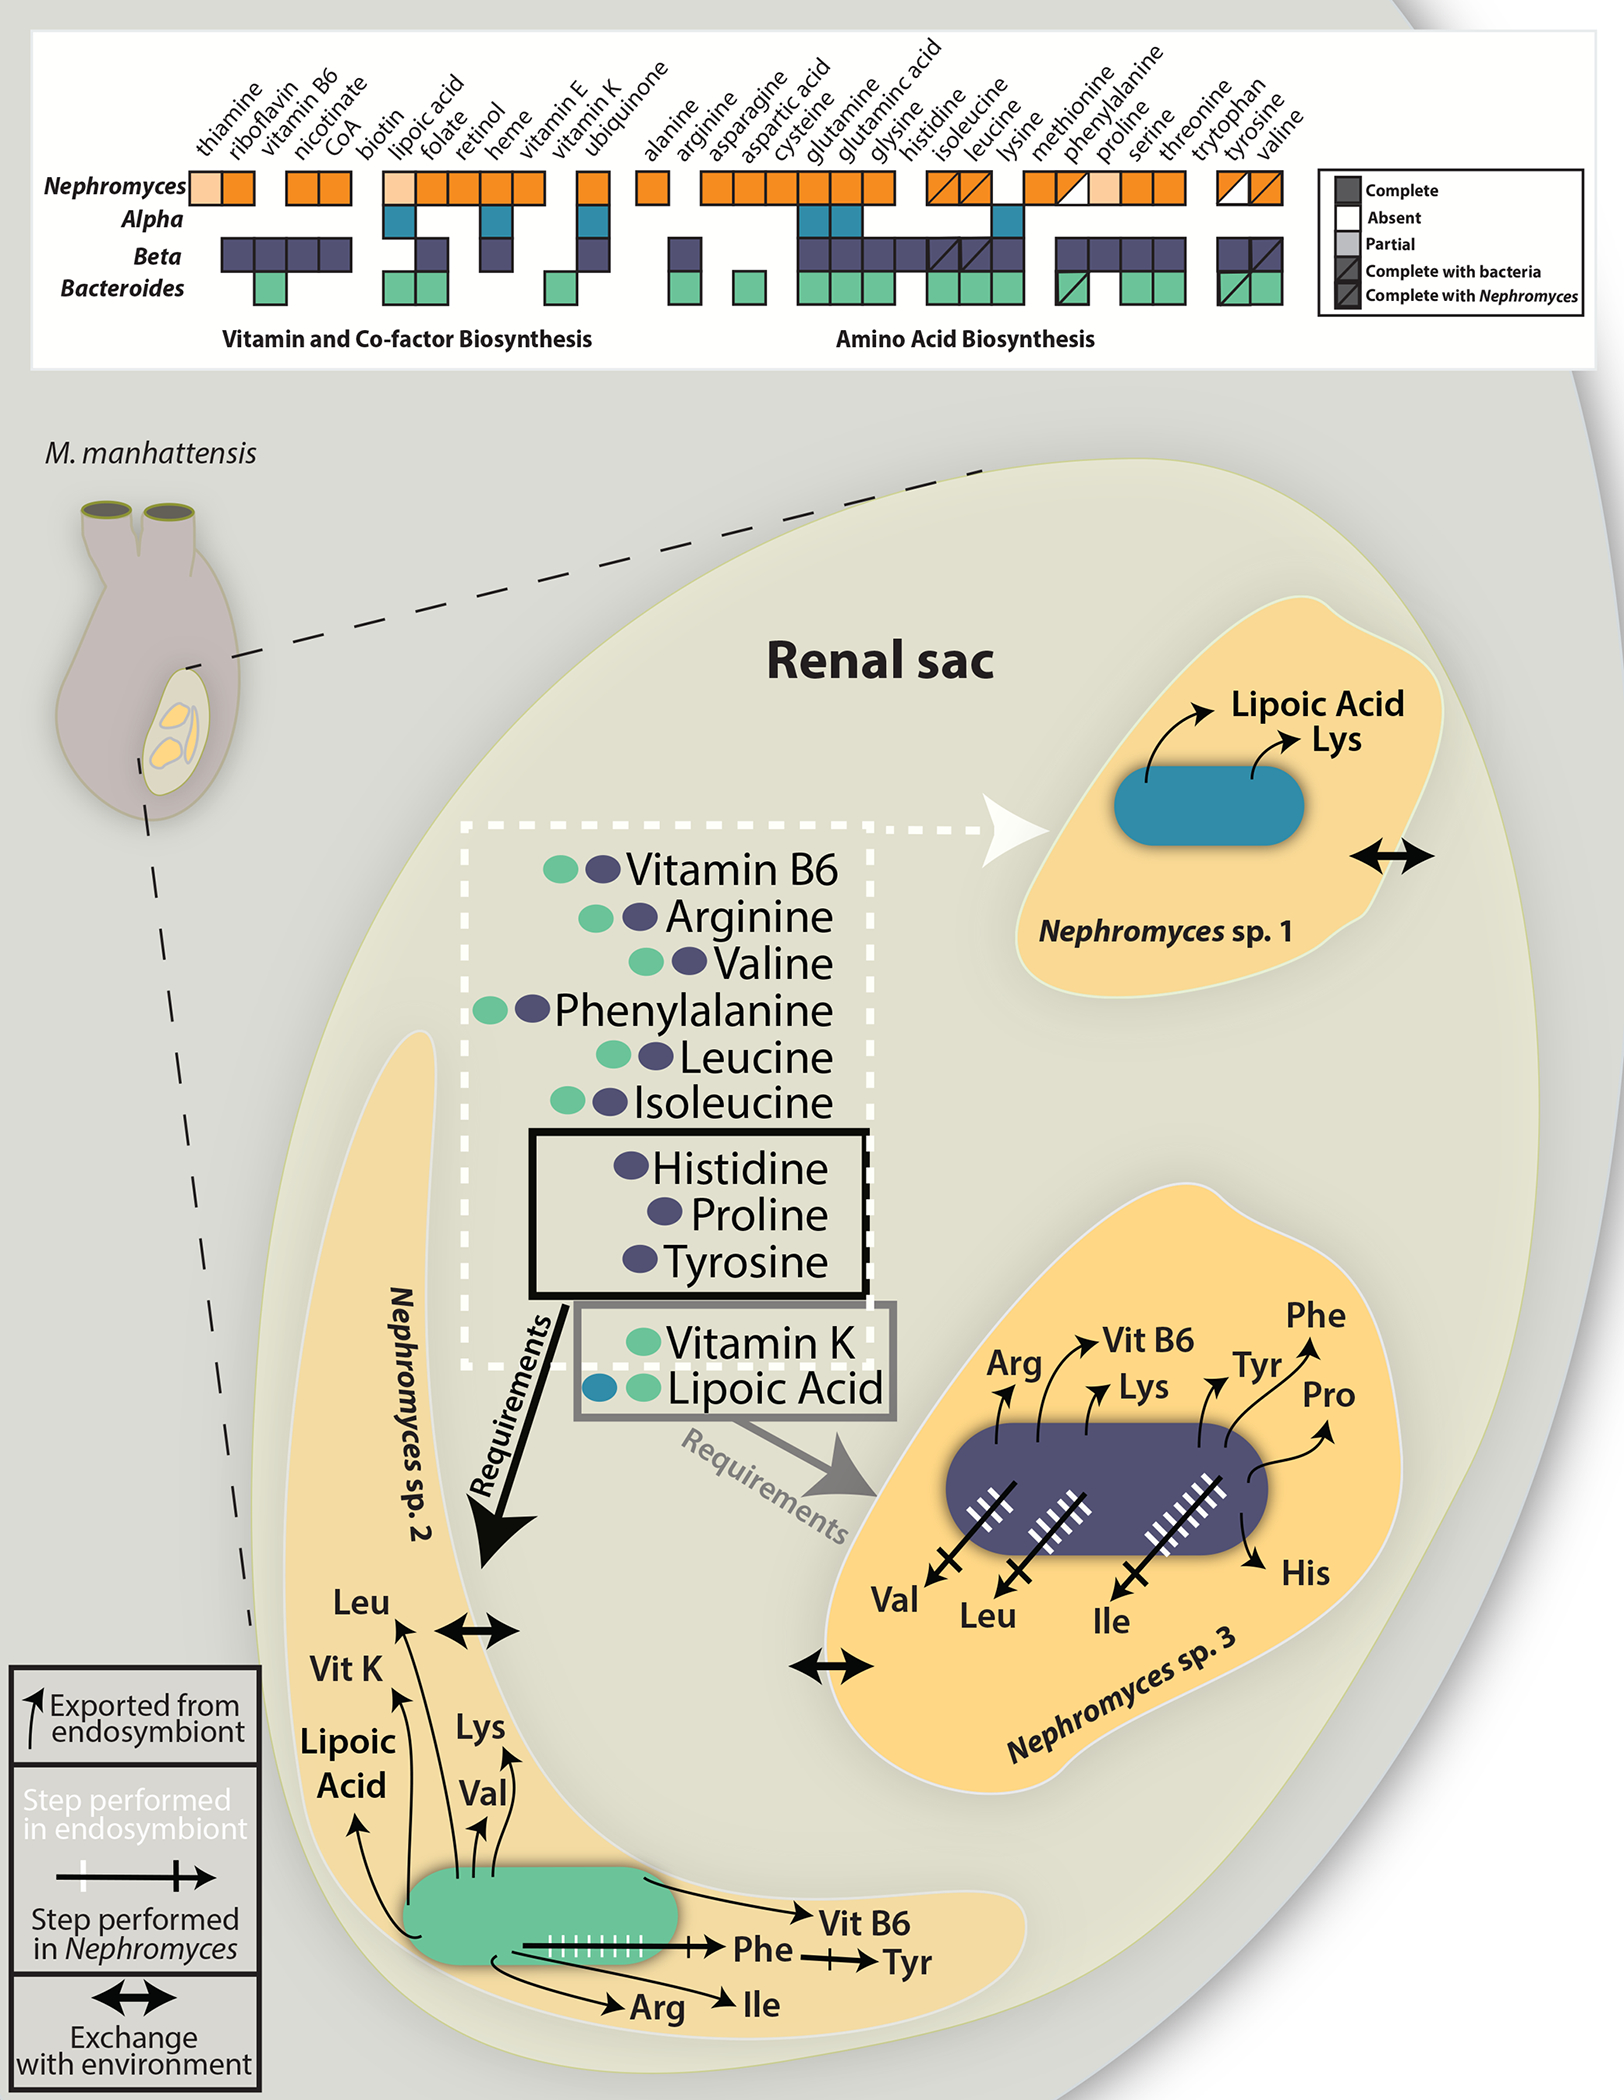
Figure 2: Reconstruction of the key metabolic exchanges within the renal sac of Molgula manhattensis.

A) Graphical representation of amino acid, vitamin and co-factor biosenthesis pathways in Nephromyces and the three types of bacterial endosymbionts. Filled boxes represent complete pathways, empty boxes indicate no genes in the pathway are encoded, light shading represent partially complete pathways, and half-filled boxes indicate pathways that require genes encoded by Nephromyces and a bacterial endosymbiont. B) The renal sac of M. manhattensis (inset) with each bacterial type represented within a different Nephromyces. Black arrows from bacteria, into each Nephromyces, represent metabolites each endosymbiont provides its host. In shared pathways, hashed arrows show the number of steps and location where the biosynthetic reactions occur (white for endosymbiont, black for Nephromyces), predicted from the genomes of each organism. In all cases, Nephromyces only encodes genes for the final biosynthetic reaction in the amino acid pathways. Arrows between the Nephromyces and the lumen of the renal sac represent the predicted exchange of metabolites. Boxes around metabolites predicted to exist in the renal sac show the requirements of the different Nephromyces with endosymbionts. Genome maps of the endosymbionts can be found in Figure S2.
