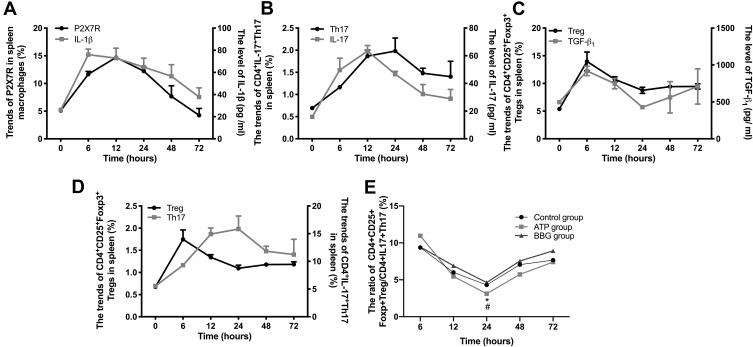
Figure 6.
The changing trend of cytokines and Treg/Th17 cells matched with the pathogenesis process of ATP-activated P2X7R-regulated acute gouty arthritis. (A) The trends of P2X7R and IL-1β in ATP group. (B) The trends of CD4+IL-17+Th17 cells and IL-17 in ATP group. (C) The trends of CD4+CD25+Foxp3+Treg cells and TGF-β1 in ATP group. (D) The trends of CD4+CD25+Foxp3+Treg cells and CD4+IL-17+Th17 cells in ATP group. (E) The ratios of Treg/Th17 among ATP group, BBG group and Control group. * P<0.05, ATP group vs BBG group, # P<0.05, ATP group vs Control group.

